

 Set up docs MCP
Run ClickStack Open Source locally, send a test event through its OpenTelemetry Collector, and confirm that the event is available in the ClickStack UI.
With ClickStack Open Source, you run and manage the ClickHouse backend, ClickStack UI, and ingestion pipeline. The all-in-one image bundles these components with MongoDB in a single Docker container for local evaluation and testing.
The steps below use the authenticated all-in-one image. If you want a local UI without creating an account, follow the local mode with Docker walkthrough instead.
Before you begin
Install Docker and confirm that the following ports are available:
8080for the ClickStack UI4317for OTLP over gRPC4318for OTLP over HTTP8123for the ClickHouse HTTP interface
For sustained or production workloads, review Open source deployment options and Going to production.
Set up ClickStack Open Source with the all-in-one image
Start ClickStack
Run the all-in-one image:
docker run \
  --name clickstack \
  -p 8123:8123 \
  -p 8080:8080 \
  -p 4317:4317 \
  -p 4318:4318 \
  clickhouse/clickstack-all-in-one:latest
The container runs in the foreground. Leave this terminal open and use a second terminal for the remaining commands in this guide.
Persist data and settings
To retain ClickStack settings, ClickHouse data, and ClickHouse logs after removing the container, run the following command instead:
docker run \
  --name clickstack \
  -p 8123:8123 \
  -p 8080:8080 \
  -p 4317:4317 \
  -p 4318:4318 \
  -v "$(pwd)/.volumes/db:/data/db" \
  -v "$(pwd)/.volumes/ch_data:/var/lib/clickhouse" \
  -v "$(pwd)/.volumes/ch_logs:/var/log/clickhouse-server" \
  clickhouse/clickstack-all-in-one:latest
$(pwd) resolves to your current directory. This command stores the persistent files in a .volumes directory at that location.
Send test data
In the second terminal, export the ingestion API key:
export CLICKSTACK_API_KEY=<your_ingestion_api_key>Send an OTLP log with the current timestamp:
NOW_NANO="$(date +%s)000000000"

curl -i "http://localhost:4318/v1/logs" \
  -H "Content-Type: application/json" \
  -H "authorization: ${CLICKSTACK_API_KEY}" \
  --data-binary @- <<EOF
{
  "resourceLogs": [{
    "resource": {
      "attributes": [{
        "key": "service.name",
        "value": {"stringValue": "clickstack-docs-test"}
      }]
    },
    "scopeLogs": [{
      "scope": {"name": "clickstack-docs-test"},
      "logRecords": [{
        "timeUnixNano": "${NOW_NANO}",
        "severityText": "INFO",
        "body": {"stringValue": "ClickStack ingestion test"}
      }]
    }]
  }]
}
EOF
A successful request returns HTTP/1.1 200 OK.
Confirm ingestion
Open the Search view in ClickStack and search for ClickStack ingestion test.
The result should include the test event with the clickstack-docs-test service name.
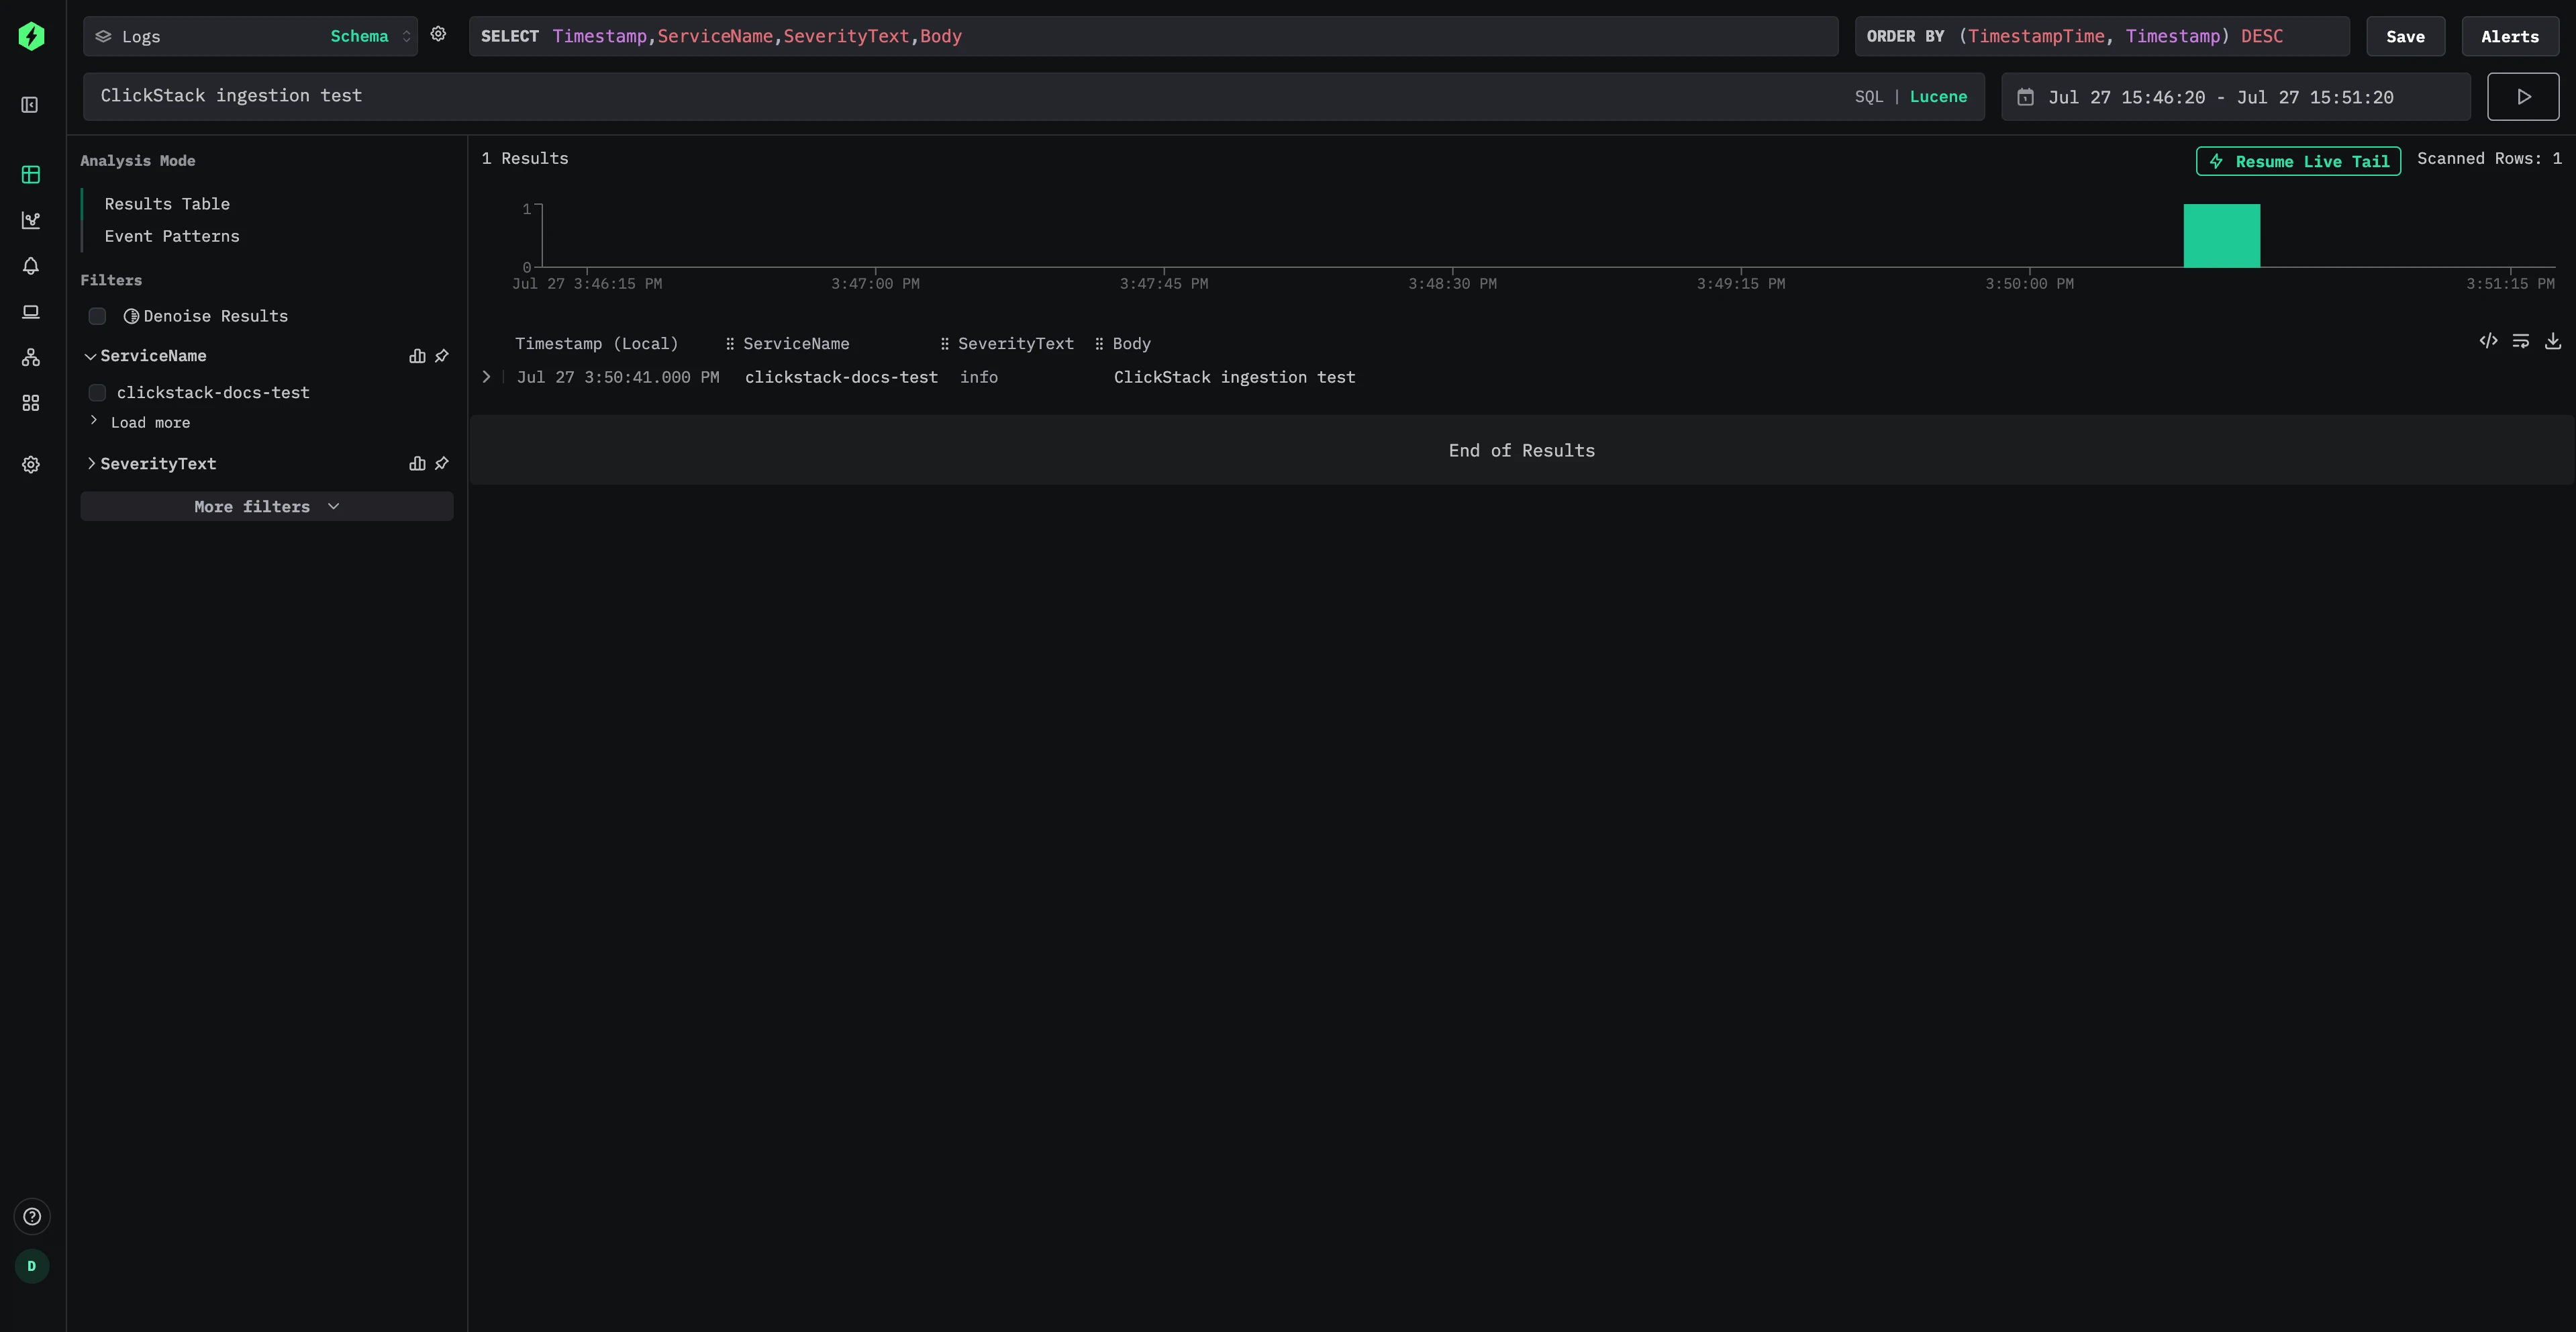
You now have a local ClickStack instance, a working ingestion endpoint, and a test event that you can inspect in ClickStack.
Next steps
Send application and infrastructure data
Choose a guide for the data that you want to send to ClickStack:
Instrument an application
Send application traces and logs with a supported OpenTelemetry SDK.
Collect host logs
Forward host logs from an OpenTelemetry Collector running in the agent role.
Monitor Kubernetes
Collect logs, metrics, and traces from a Kubernetes cluster.
Explore other integrations
Find guides for additional applications and telemetry sources.
Explore sample data
Use a sample dataset to explore ClickStack with richer telemetry:
Sample logs, traces, and metrics
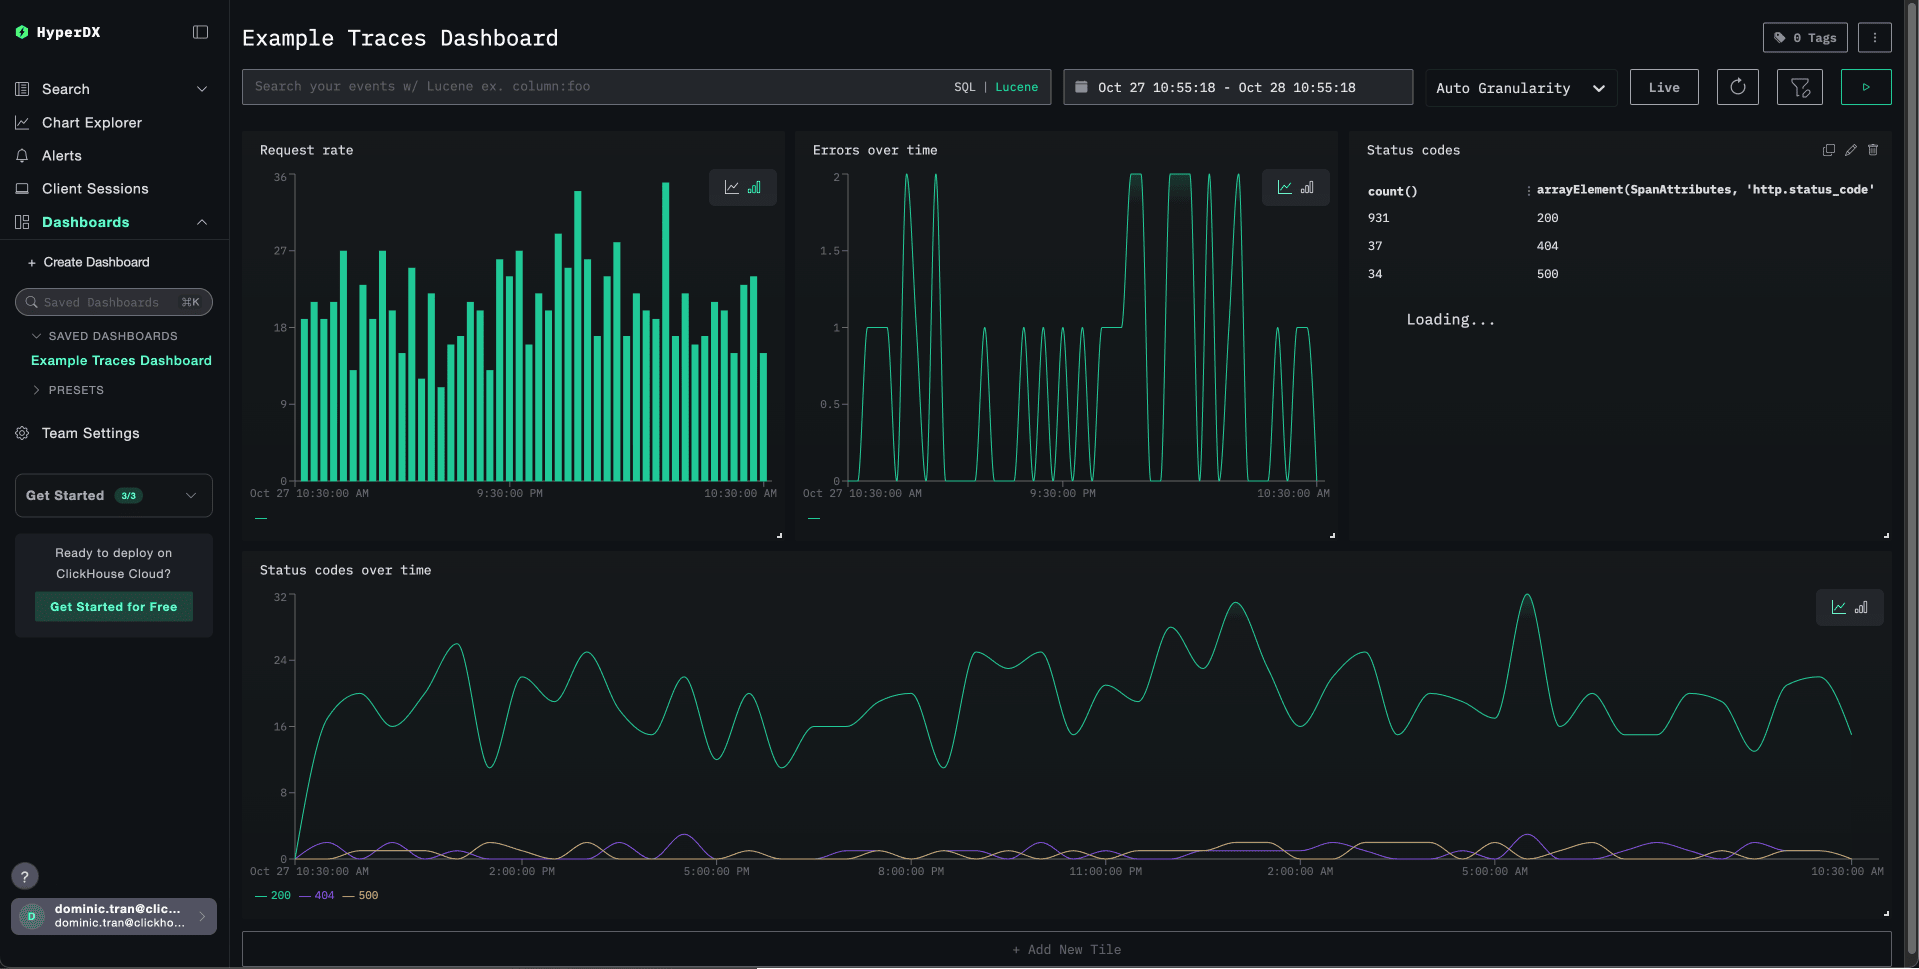
Load data from the public demo and diagnose an issue.
Local logs and metrics
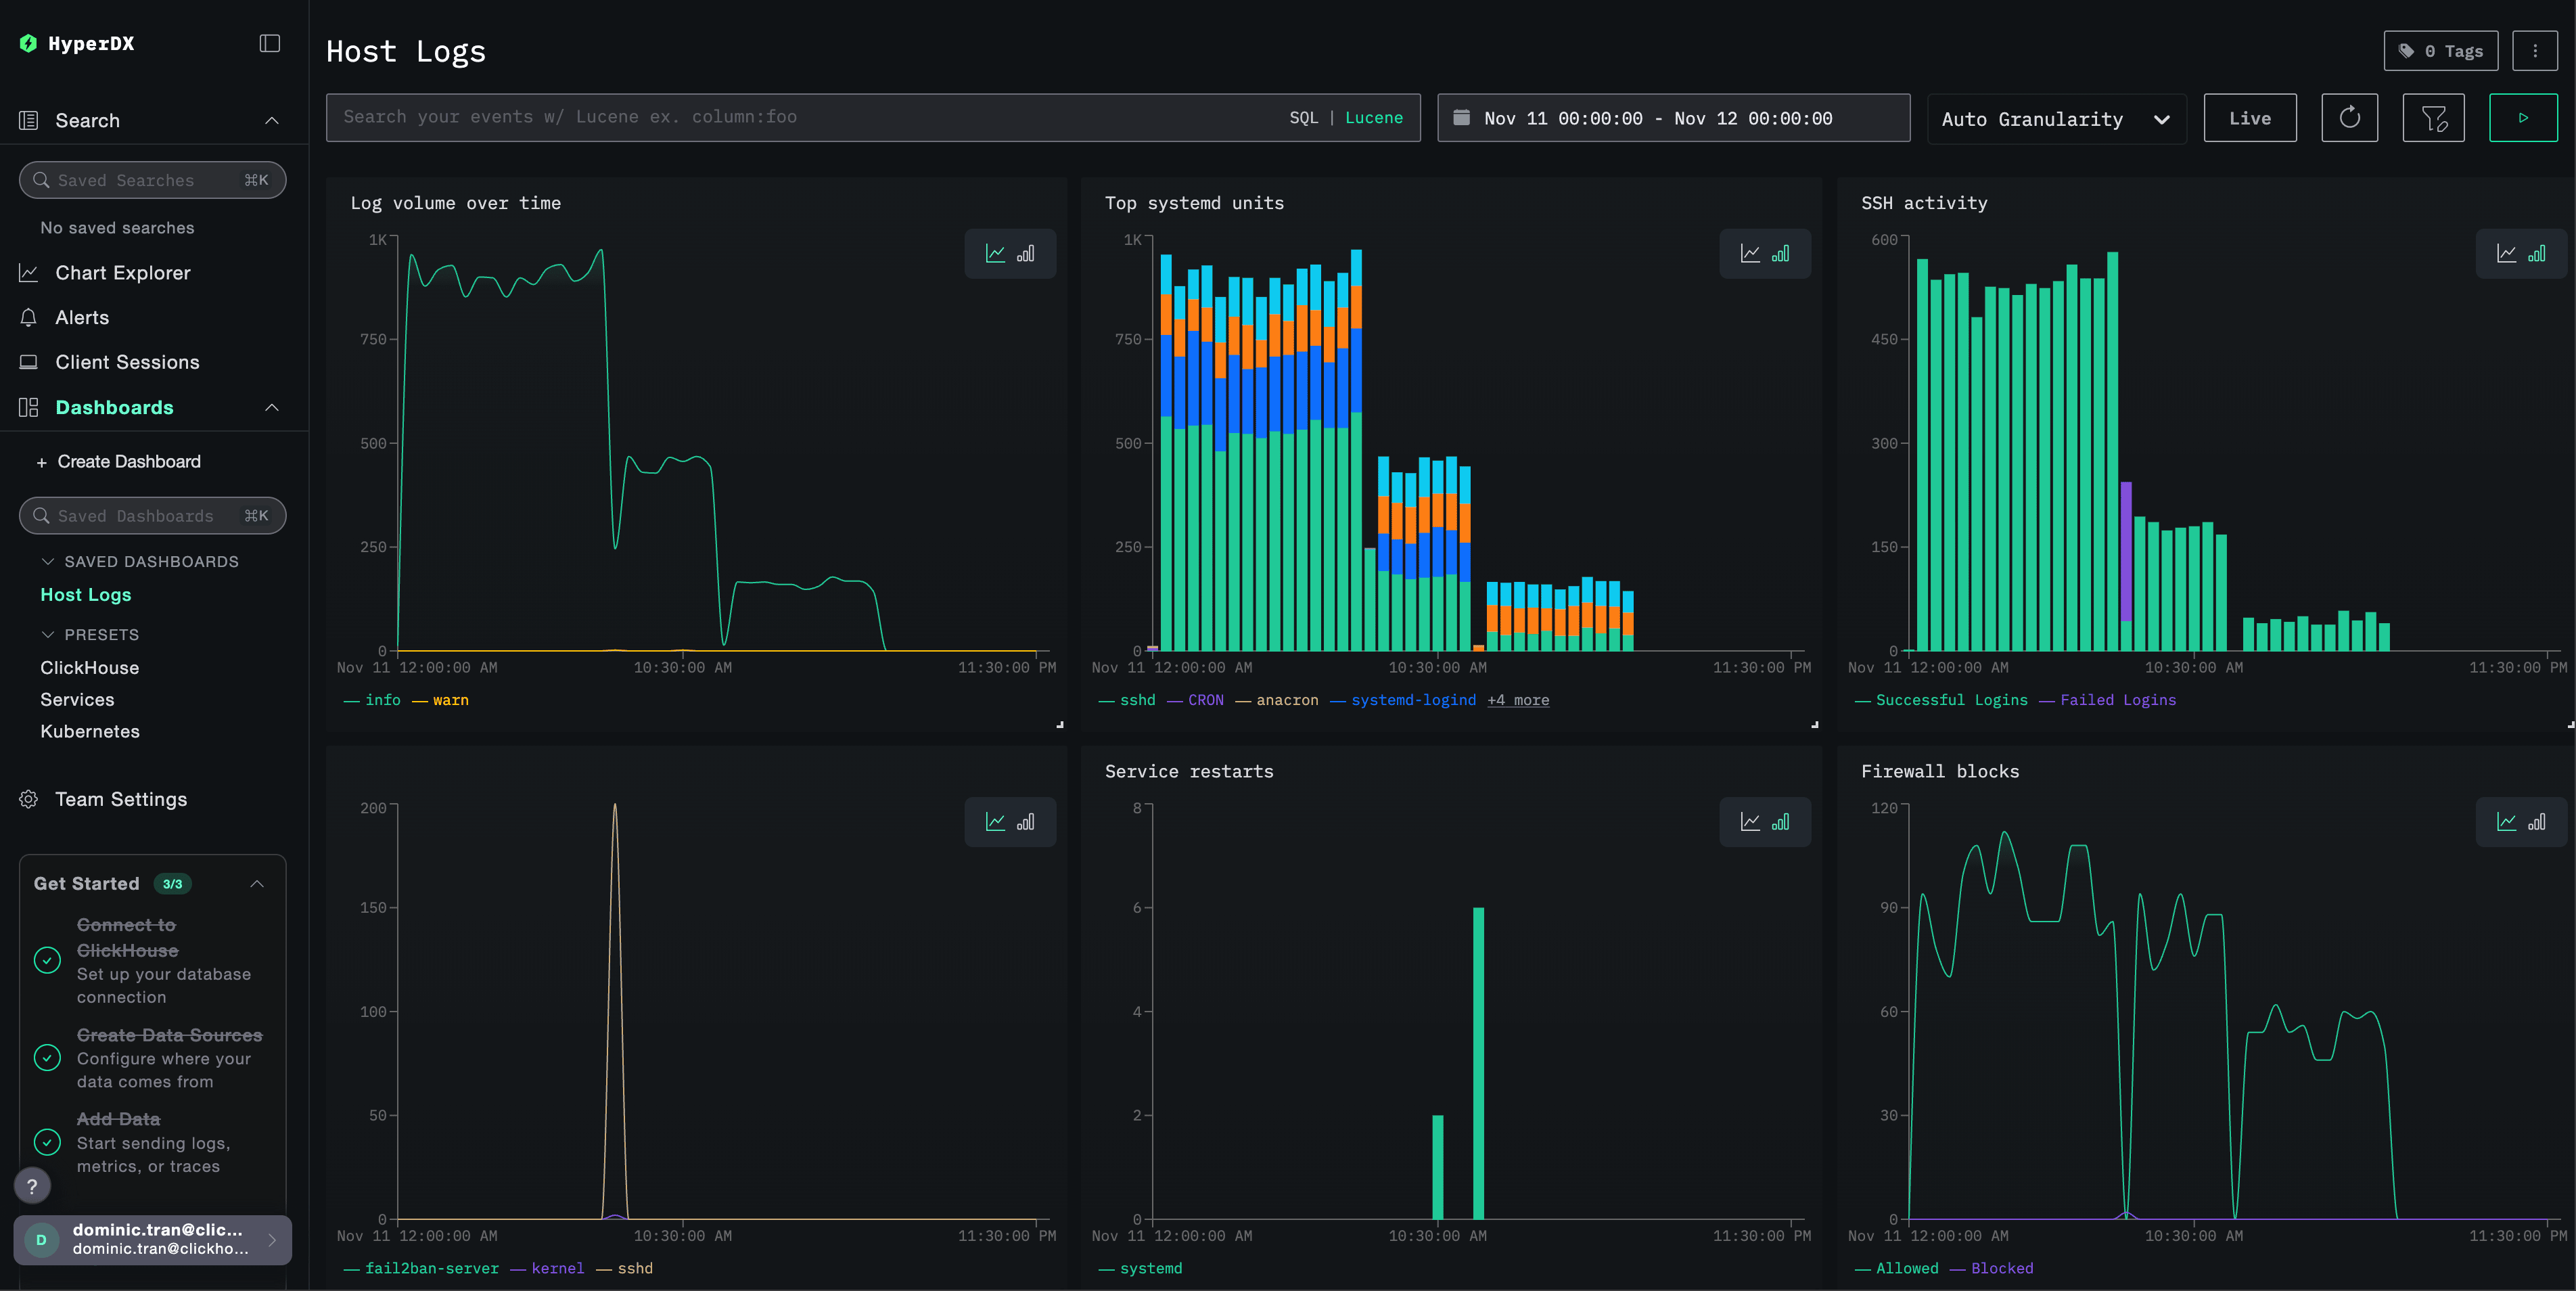
Collect local files and system metrics on macOS or Linux.
To explore preloaded data without installing Docker, use the hosted ClickStack demo.
Generate synthetic data
Use a generator to test ingestion without an existing application or dataset:
Generate data with otelgen
Send a short burst of synthetic OTLP logs, traces, and metrics.
Generate data with telemetrygen
Generate configurable OpenTelemetry signals across several services.
See all ClickStack sample data and demos.
Prepare for production
Review deployment and production guidance before using ClickStack for sustained workloads: