

 Set up docs MCP
What is bitdrift?
bitdrift is a dynamic observability platform built specifically for mobile applications. It has three core components:
- The Capture SDK, a lightweight, cross-platform library built in Rust with thin platform-specific wrappers, that writes telemetry to a fixed-size ring buffer on the device rather than streaming it off immediately.
- The control plane, which maintains a persistent bidirectional connection to every client and pushes new configuration in real time, deciding what gets collected and what gets uploaded.
- The bitdrift platform, where workflows, session timelines, charts, issues, and alerts turn mobile telemetry into answers, accessible through the web UI, CLI, AI agents, and a public API.
bitdrift keeps mobile telemetry at the edge until it’s requested, so teams can pull the full, unsampled session that led to a crash or performance issue instead of working from a fixed, pre-sampled set of signals. The bitdrift Capture platform is available as bitdrift-hosted SaaS or as a bring-your-own-cloud (or bucket) deployment in your AWS account.
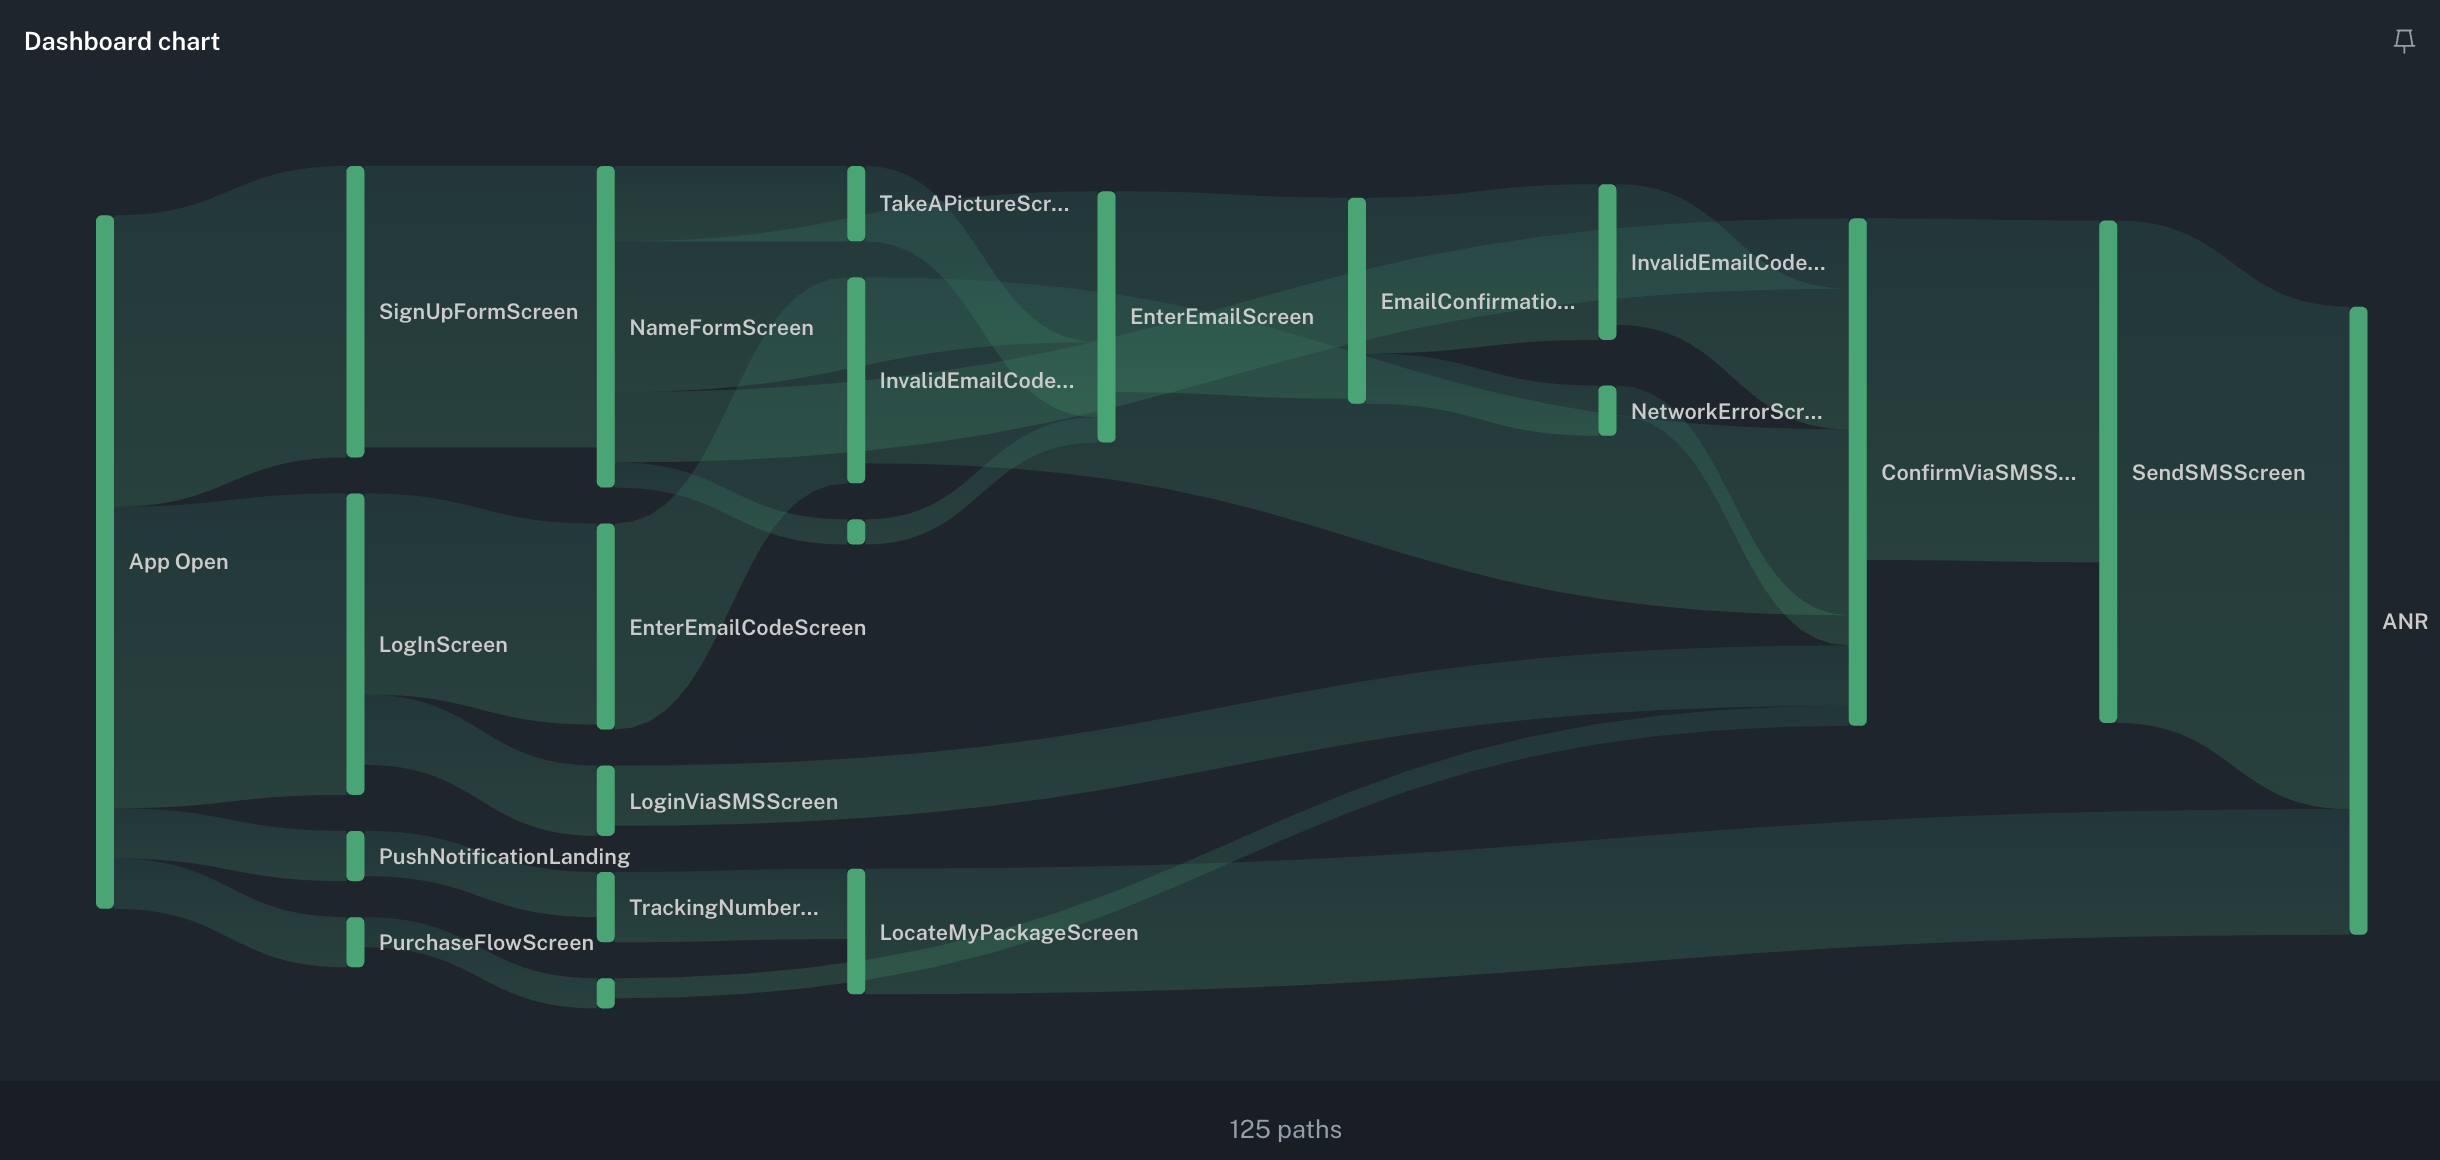
A bitdrift User Journey dashboard showing the paths users take to an ANR.
Why bitdrift + ClickStack?
ClickStack gives engineering teams an observability solution built on ClickHouse that collects, stores, and queries data across backend services, web frontends, and infrastructure. bitdrift extends that foundation to the mobile device, where many of the hardest production issues start.
- bitdrift shows what happened on the device: user actions, app state, network requests, logs, errors, crashes, performance signals, and the surrounding session context.
- ClickStack shows what happened once the request reached the backend: distributed traces, service dependencies, logs, metrics, database operations, and infrastructure behavior.
- OpenTelemetry trace context ties the two together.
An investigation might start with a failed checkout, a slow screen load, an auth error, or a crash in bitdrift. From the network request, an engineer follows the trace ID into the ClickStack UI, powered by HyperDX, and watches the request move across backend services, with no manual reconstruction from scattered timestamps.
Prerequisites
- ClickStack installed and reachable from your backend services, either self-managed or on ClickHouse Cloud. See Getting started with open source ClickStack or Getting started with managed ClickStack.
- Your backend services instrumented with OpenTelemetry and sending traces to ClickStack. See Ingesting with OpenTelemetry.
- The bitdrift Capture SDK integrated in your mobile app. See the bitdrift SDK documentation for install instructions.
- A bitdrift account, with Support available to enable tracing for your tenant (tracing is an experimental feature that bitdrift enables per tenant).
Configure tracing
Configuration happens entirely on the bitdrift side, in three steps:
- Ask bitdrift Support to enable tracing for your tenant and to configure trace deep linking to your ClickStack (HyperDX) instance. The deep-link configuration is what points the View Trace links at your ClickStack UI; without it, tracing is captured but no View Trace link appears.
- Enable bitdrift’s network integration for your platform, so that tracing headers are propagated on outgoing requests.
- Add a Start Tracing workflow action, to turn on tracing for the sessions you care about.
For the platform-specific details of each step, see How bitdrift and ClickStack work together in the bitdrift documentation.
Once configured, bitdrift timeline log rows and span views show a View Trace link that carries the captured trace ID into the ClickStack UI (HyperDX).
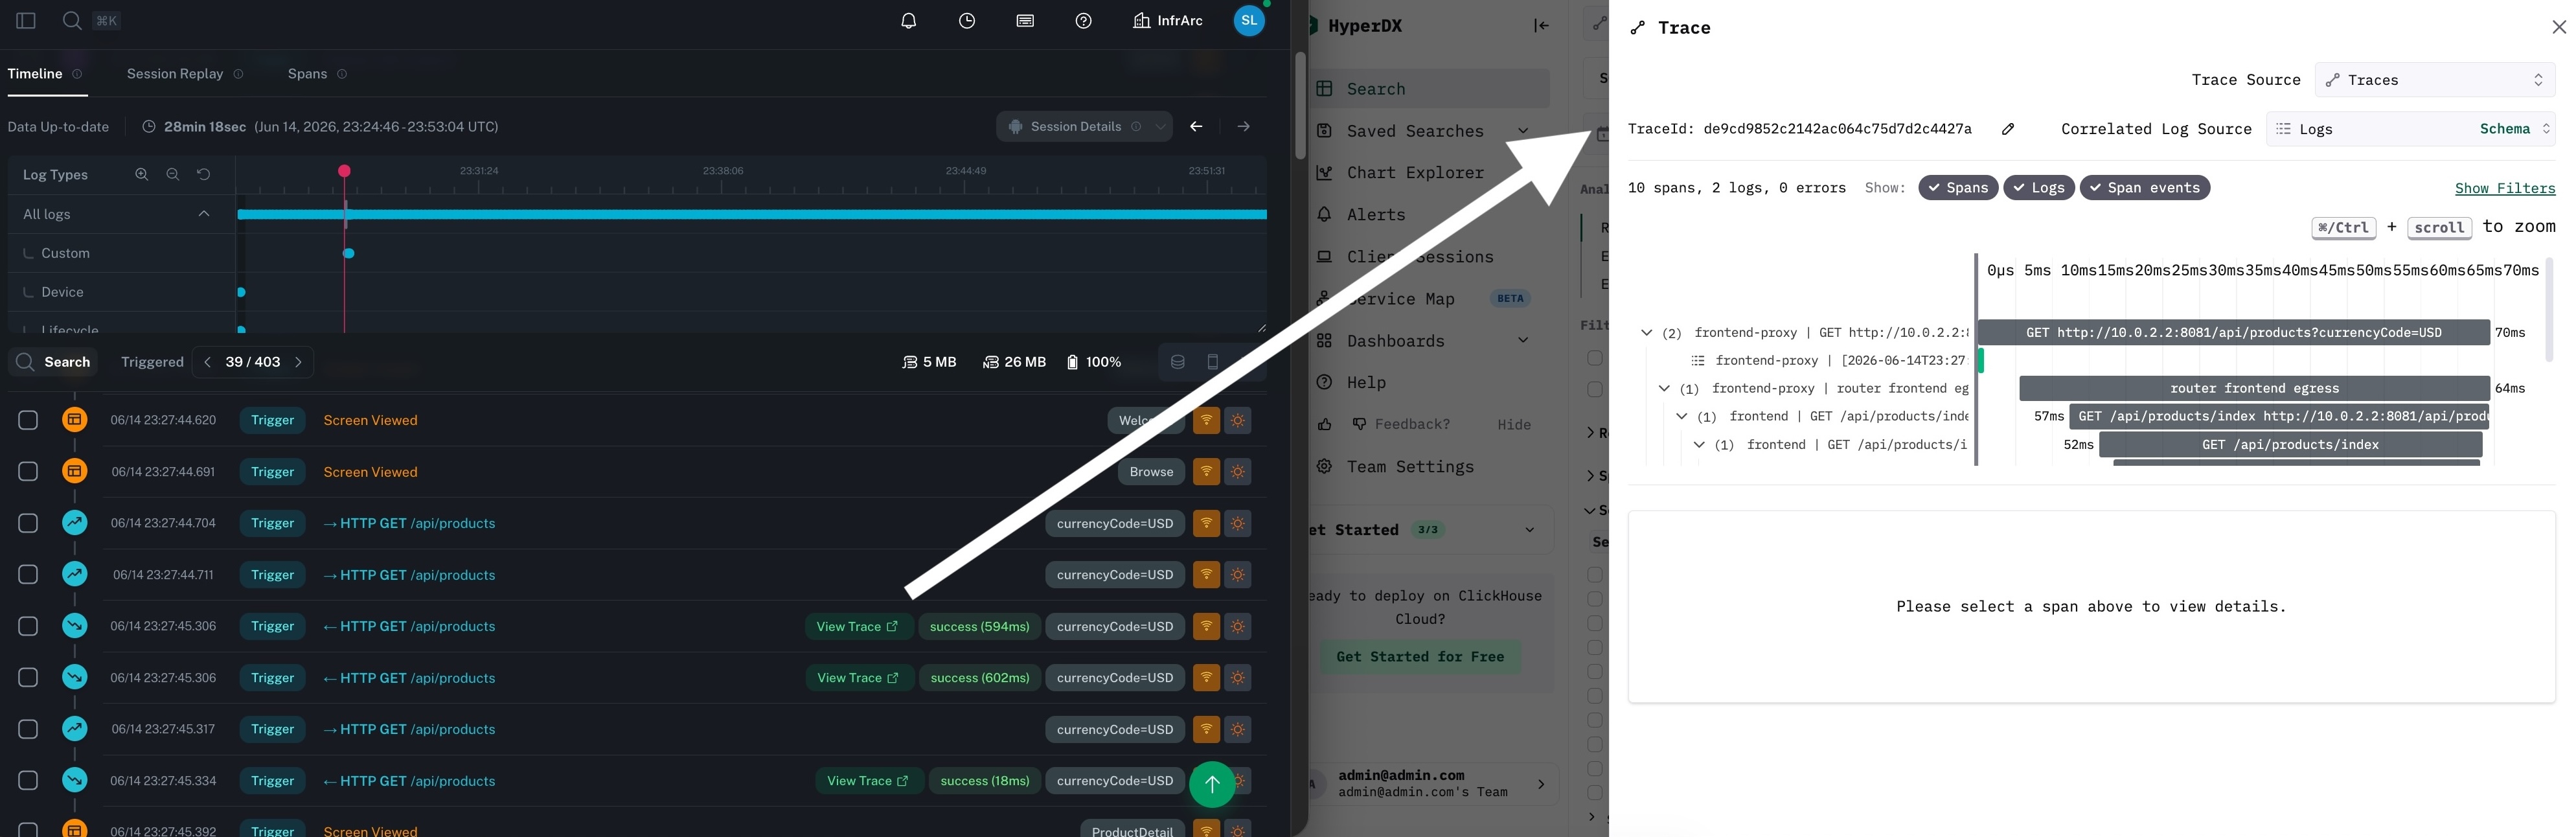
Following a View Trace link from a bitdrift session into a distributed trace in the ClickStack UI (HyperDX).
Deployment flexibility
The integration works whether ClickStack is self-managed or run as a managed offering on ClickHouse Cloud, because it does not change how data reaches ClickStack. bitdrift does not export mobile telemetry into ClickStack: it captures the OpenTelemetry trace context of a request on the device and links to the backend trace that your own OpenTelemetry-instrumented services already send to ClickStack. All bitdrift needs is the address of your ClickStack UI (HyperDX) in order to build the View Trace link, so no changes to your ClickStack deployment or its ingestion pipeline are required.
Next steps
- Follow a real investigation from a mobile crash or slow request in bitdrift into the backend trace in ClickStack
- Build dashboards in ClickStack (HyperDX) for the backend services your mobile app depends on
- Check out the bitdrift sandbox to see what working with Capture is like
- Start a free trial to add bitdrift to your mobile app