

 Set up docs MCP
The feature supports integrating Prometheus to monitor ClickHouse Cloud services. Access to Prometheus metrics is exposed via the ClickHouse Cloud API endpoint that allows you to securely connect and export metrics into your Prometheus metrics collector. These metrics can be integrated with dashboards e.g., Grafana, Datadog for visualization.
Metrics for ClickPipes attached to a service are included alongside that service’s ClickHouse metrics.
To get started, generate an API key.
If you’re looking for the equivalent endpoint for ClickHouse Managed Postgres services, see the ClickHouse Managed Postgres Prometheus endpoint.
Prometheus endpoint API to retrieve ClickHouse Cloud metrics
API reference
| Method | Path | Description |
|---|---|---|
| GET | https://api.clickhouse.cloud/v1/organizations/:organizationId/services/:serviceId/prometheus?filtered_metrics=[true | false] |
Returns metrics for a specific service |
| GET | https://api.clickhouse.cloud/v1/organizations/:organizationId/prometheus?filtered_metrics=[true | false] |
Deprecated. Returns metrics for all services in an organization |
| GET | https://api.clickhouse.cloud/v1/organizations/:organizationId/prometheus/discovery?filtered_metrics=[true | false] |
Returns Prometheus scrape targets for all services in an organization, in the HTTP service discovery format |
Request Parameters
| Name | Location | Type |
|---|---|---|
| Organization ID | Endpoint address | uuid |
| Service ID | Endpoint address | uuid (optional) |
| filtered_metrics | Query param | boolean (optional) |
Full request and response schemas for these endpoints are available in the Cloud API reference.
Authentication
Use your ClickHouse Cloud API key for basic authentication:
Username: <KEY_ID>
Password: <KEY_SECRET>
Example request
export KEY_SECRET=<key_secret>
export KEY_ID=<key_id>
export ORG_ID=<org_id>

# For all services in $ORG_ID
curl --silent --user $KEY_ID:$KEY_SECRET https://api.clickhouse.cloud/v1/organizations/$ORG_ID/prometheus?filtered_metrics=true

# For a single service only
export SERVICE_ID=<service_id>
curl --silent --user $KEY_ID:$KEY_SECRET https://api.clickhouse.cloud/v1/organizations/$ORG_ID/services/$SERVICE_ID/prometheus?filtered_metrics=true
Sample response
# HELP ClickHouse_ServiceInfo Information about service, including cluster status and ClickHouse version
# TYPE ClickHouse_ServiceInfo untyped
ClickHouse_ServiceInfo{clickhouse_org="c2ba4799-a76e-456f-a71a-b021b1fafe60",clickhouse_service="12f4a114-9746-4a75-9ce5-161ec3a73c4c",clickhouse_service_name="test service",clickhouse_cluster_status="running",clickhouse_version="24.5",scrape="full"} 1

# HELP ClickHouseProfileEvents_Query Number of queries to be interpreted and potentially executed. Does not include queries that failed to parse or were rejected due to AST size limits, quota limits or limits on the number of simultaneously running queries. May include internal queries initiated by ClickHouse itself. Does not count subqueries.
# TYPE ClickHouseProfileEvents_Query counter
ClickHouseProfileEvents_Query{clickhouse_org="c2ba4799-a76e-456f-a71a-b021b1fafe60",clickhouse_service="12f4a114-9746-4a75-9ce5-161ec3a73c4c",clickhouse_service_name="test service",hostname="c-cream-ma-20-server-3vd2ehh-0",instance="c-cream-ma-20-server-3vd2ehh-0",table="system.events"} 6

# HELP ClickHouseProfileEvents_QueriesWithSubqueries Count queries with all subqueries
# TYPE ClickHouseProfileEvents_QueriesWithSubqueries counter
ClickHouseProfileEvents_QueriesWithSubqueries{clickhouse_org="c2ba4799-a76e-456f-a71a-b021b1fafe60",clickhouse_service="12f4a114-9746-4a75-9ce5-161ec3a73c4c",clickhouse_service_name="test service",hostname="c-cream-ma-20-server-3vd2ehh-0",instance="c-cream-ma-20-server-3vd2ehh-0",table="system.events"} 230

# HELP ClickHouseProfileEvents_SelectQueriesWithSubqueries Count SELECT queries with all subqueries
# TYPE ClickHouseProfileEvents_SelectQueriesWithSubqueries counter
ClickHouseProfileEvents_SelectQueriesWithSubqueries{clickhouse_org="c2ba4799-a76e-456f-a71a-b021b1fafe60",clickhouse_service="12f4a114-9746-4a75-9ce5-161ec3a73c4c",clickhouse_service_name="test service",hostname="c-cream-ma-20-server-3vd2ehh-0",instance="c-cream-ma-20-server-3vd2ehh-0",table="system.events"} 224

# HELP ClickHouseProfileEvents_FileOpen Number of files opened.
# TYPE ClickHouseProfileEvents_FileOpen counter
ClickHouseProfileEvents_FileOpen{clickhouse_org="c2ba4799-a76e-456f-a71a-b021b1fafe60",clickhouse_service="12f4a114-9746-4a75-9ce5-161ec3a73c4c",clickhouse_service_name="test service",hostname="c-cream-ma-20-server-3vd2ehh-0",instance="c-cream-ma-20-server-3vd2ehh-0",table="system.events"} 4157

# HELP ClickHouseProfileEvents_Seek Number of times the 'lseek' function was called.
# TYPE ClickHouseProfileEvents_Seek counter
ClickHouseProfileEvents_Seek{clickhouse_org="c2ba4799-a76e-456f-a71a-b021b1fafe60",clickhouse_service="12f4a114-9746-4a75-9ce5-161ec3a73c4c",clickhouse_service_name="test service",hostname="c-cream-ma-20-server-3vd2ehh-0",instance="c-cream-ma-20-server-3vd2ehh-0",table="system.events"} 1840

# HELP ClickPipes_Info Always equal to 1. Label "clickpipe_state" contains the current state of the pipe: Stopped/Provisioning/Running/Paused/Failed
# TYPE ClickPipes_Info gauge
ClickPipes_Info{clickhouse_org="11dfa1ec-767d-43cb-bfad-618ce2aaf959",clickhouse_service="82b83b6a-5568-4a82-aa78-fed9239db83f",clickhouse_service_name="ClickPipes demo instace",clickpipe_id="642bb967-940b-459e-9f63-a2833f62ec44",clickpipe_name="Confluent demo pipe",clickpipe_source="confluent",clickpipe_status="Running"} 1

# HELP ClickPipes_SentEvents_Total Total number of records sent to ClickHouse
# TYPE ClickPipes_SentEvents_Total counter
ClickPipes_SentEvents_Total{clickhouse_org="11dfa1ec-767d-43cb-bfad-618ce2aaf959",clickhouse_service="82b83b6a-5568-4a82-aa78-fed9239db83f",clickhouse_service_name="ClickPipes demo instace",clickpipe_id="642bb967-940b-459e-9f63-a2833f62ec44",clickpipe_name="Confluent demo pipe",clickpipe_source="confluent"} 5534250

# HELP ClickPipes_SentBytesCompressed_Total Total compressed bytes sent to ClickHouse.
# TYPE ClickPipes_SentBytesCompressed_Total counter
ClickPipes_SentBytesCompressed_Total{clickhouse_org="11dfa1ec-767d-43cb-bfad-618ce2aaf959",clickhouse_service="82b83b6a-5568-4a82-aa78-fed9239db83f",clickhouse_service_name
="ClickPipes demo instace",clickpipe_id="642bb967-940b-459e-9f63-a2833f62ec44",clickpipe_name="Confluent demo pipe",clickpipe_source="confluent"} 380837520
ClickPipes_SentBytesCompressed_Total{clickhouse_org="11dfa1ec-767d-43cb-bfad-618ce2aaf959",clickhouse_service="82b83b6a-5568-4a82-aa78-fed9239db83f",clickhouse_service_name

# HELP ClickPipes_FetchedBytes_Total Total uncompressed bytes fetched from the source.
# TYPE ClickPipes_FetchedBytes_Total counter
ClickPipes_FetchedBytes_Total{clickhouse_org="11dfa1ec-767d-43cb-bfad-618ce2aaf959",clickhouse_service="82b83b6a-5568-4a82-aa78-fed9239db83f",clickhouse_service_name="ClickPipes demo instace",clickpipe_id="642bb967-940b-459e-9f63-a2833f62ec44",clickpipe_name="Confluent demo pipe",clickpipe_source="confluent"} 873286202

# HELP ClickPipes_Errors_Total Total errors ingesting data.
# TYPE ClickPipes_Errors_Total counter
ClickPipes_Errors_Total{clickhouse_org="11dfa1ec-767d-43cb-bfad-618ce2aaf959",clickhouse_service="82b83b6a-5568-4a82-aa78-fed9239db83f",clickhouse_service_name="ClickPipes demo instace",clickpipe_id="642bb967-940b-459e-9f63-a2833f62ec44",clickpipe_name="Confluent demo pipe",clickpipe_source="confluent"} 0

# HELP ClickPipes_SentBytes_Total Total uncompressed bytes sent to ClickHouse.
# TYPE ClickPipes_SentBytes_Total counter
ClickPipes_SentBytes_Total{clickhouse_org="11dfa1ec-767d-43cb-bfad-618ce2aaf959",clickhouse_service="82b83b6a-5568-4a82-aa78-fed9239db83f",clickhouse_service_name="ClickPipes demo instace",clickpipe_id="642bb967-940b-459e-9f63-a2833f62ec44",clickpipe_name="Confluent demo pipe",clickpipe_source="confluent"} 477187967

# HELP ClickPipes_FetchedBytesCompressed_Total Total compressed bytes fetched from the source. If data is uncompressed at the source, this will equal ClickPipes_FetchedBytes_Total
# TYPE ClickPipes_FetchedBytesCompressed_Total counter
ClickPipes_FetchedBytesCompressed_Total{clickhouse_org="11dfa1ec-767d-43cb-bfad-618ce2aaf959",clickhouse_service="82b83b6a-5568-4a82-aa78-fed9239db83f",clickhouse_service_name="ClickPipes demo instace",clickpipe_id="642bb967-940b-459e-9f63-a2833f62ec44",clickpipe_name="Confluent demo pipe",clickpipe_source="confluent"} 873286202

# HELP ClickPipes_FetchedEvents_Total Total number of records fetched from the source.
# TYPE ClickPipes_FetchedEvents_Total counter
ClickPipes_FetchedEvents_Total{clickhouse_org="11dfa1ec-767d-43cb-bfad-618ce2aaf959",clickhouse_service="82b83b6a-5568-4a82-aa78-fed9239db83f",clickhouse_service_name="ClickPipes demo instace",clickpipe_id="642bb967-940b-459e-9f63-a2833f62ec44",clickpipe_name="Confluent demo pipe",clickpipe_source="confluent"} 5535376
Metric labels
All metrics have the following labels:
| Label | Description |
|---|---|
| clickhouse_org | Organization ID |
| clickhouse_service | Service ID |
| clickhouse_service_name | Service name |
For ClickPipes, metrics will also have the following labels:
| Label | Description |
|---|---|
| clickpipe_id | ClickPipe ID |
| clickpipe_name | ClickPipe Name |
| clickpipe_source | ClickPipe Source Type |
Information metrics
ClickHouse Cloud provides a special metric ClickHouse_ServiceInfo which is a gauge that always has the value of 1. This metric contains all the Metric Labels as well as the following labels:
| Label | Description |
|---|---|
| clickhouse_cluster_status | Status of the service. Could be one of the following: [awaking | running | degraded | idle | stopped] |
| clickhouse_version | Version of the ClickHouse server that the service is running |
| scrape | Indicates the status of the last scrape. Could be either full or partial |
| full | Indicates that there were no errors during the last metrics scrape |
| partial | Indicates that there were some errors during the last metrics scrape and only ClickHouse_ServiceInfo metric was returned. |
Requests to retrieve metrics won’t resume an idled service. In the case that a service is in the idle state, only the ClickHouse_ServiceInfo metric will be returned.
For ClickPipes, there’s a similar ClickPipes_Info metric gauge that in addition of the Metric Labels contains the following labels:
| Label | Description |
|---|---|
| clickpipe_state | The current state of the pipe |
Configuring Prometheus
The Prometheus server collects metrics from configured targets at the given intervals. Below is an example configuration for the Prometheus server to use the ClickHouse Cloud Prometheus Endpoint:
global:
  scrape_interval: 15s

scrape_configs:
  - job_name: "prometheus"
    static_configs:
    - targets: ["localhost:9090"]
  - job_name: "clickhouse"
    static_configs:
      - targets: ["api.clickhouse.cloud"]
    scheme: https
    params:
      filtered_metrics: ["true"]
    metrics_path: "/v1/organizations/<ORG_ID>/prometheus"
    basic_auth:
      username: <KEY_ID>
      password: <KEY_SECRET>
    honor_labels: true
Note the honor_labels configuration parameter needs to be set to true for the instance label to be properly populated. Additionally, filtered_metrics is set to true in the above example, but should be configured based on user preference.
Automatic service discovery
Beta featureThe discovery endpoint returns one scrape target per service in your organization, in the Prometheus HTTP service discovery (http_sd) format. Prometheus refreshes the target list on every discovery poll and scrapes each discovered target, so newly created services are picked up automatically and deleted services are dropped from the target list. Only services your API key is authorized to view are included; services that are being deleted or have been deleted are omitted.
To use it, point an http_sd_configs job at the discovery endpoint:
global:
  scrape_interval: 15s

scrape_configs:
  - job_name: "clickhouse"
    http_sd_configs:
      - url: https://api.clickhouse.cloud/v1/organizations/<ORG_ID>/prometheus/discovery
        refresh_interval: 60s
        basic_auth:
          username: <KEY_ID>
          password: <KEY_SECRET>
    basic_auth:
      username: <KEY_ID>
      password: <KEY_SECRET>
    honor_labels: true
Set basic_auth in both places: the block under http_sd_configs authenticates the discovery polls, and the block on the scrape job authenticates the per-service metric scrapes. As with the static configuration, set honor_labels: true so the instance label is properly populated.
A sample discovery response:
[
  {
    "targets": ["api.clickhouse.cloud"],
    "labels": {
      "__scheme__": "https",
      "__metrics_path__": "/v1/organizations/<ORG_ID>/services/<SERVICE_ID>/prometheus",
      "__param_filtered_metrics": "true",
      "clickhouse_org_id": "<ORG_ID>",
      "clickhouse_service_id": "<SERVICE_ID>",
      "clickhouse_discovery_service_name": "my service"
    }
  }
]
Discovered targets scrape with filtered_metrics=true. To discover targets that scrape the full metric set, add ?filtered_metrics=false to the discovery URL. The full endpoint specification is available in the Cloud API reference.
Integrating with Grafana
Users have two primary ways to integrate with Grafana:
- Metrics Endpoint – This approach has the advantage of not requiring any additional components or infrastructure. This offering is limited to Grafana Cloud and only requires the ClickHouse Cloud Prometheus Endpoint URL and credentials.
- Grafana Alloy - Grafana Alloy is a vendor-neutral distribution of the OpenTelemetry (OTel) Collector, replacing the Grafana Agent. This can be used as a scraper, is deployable in your own infrastructure, and is compatible with any Prometheus endpoint.
We provide instructions on using these options below, focusing on the details specific to the ClickHouse Cloud Prometheus Endpoint.
Grafana Cloud with metrics endpoint
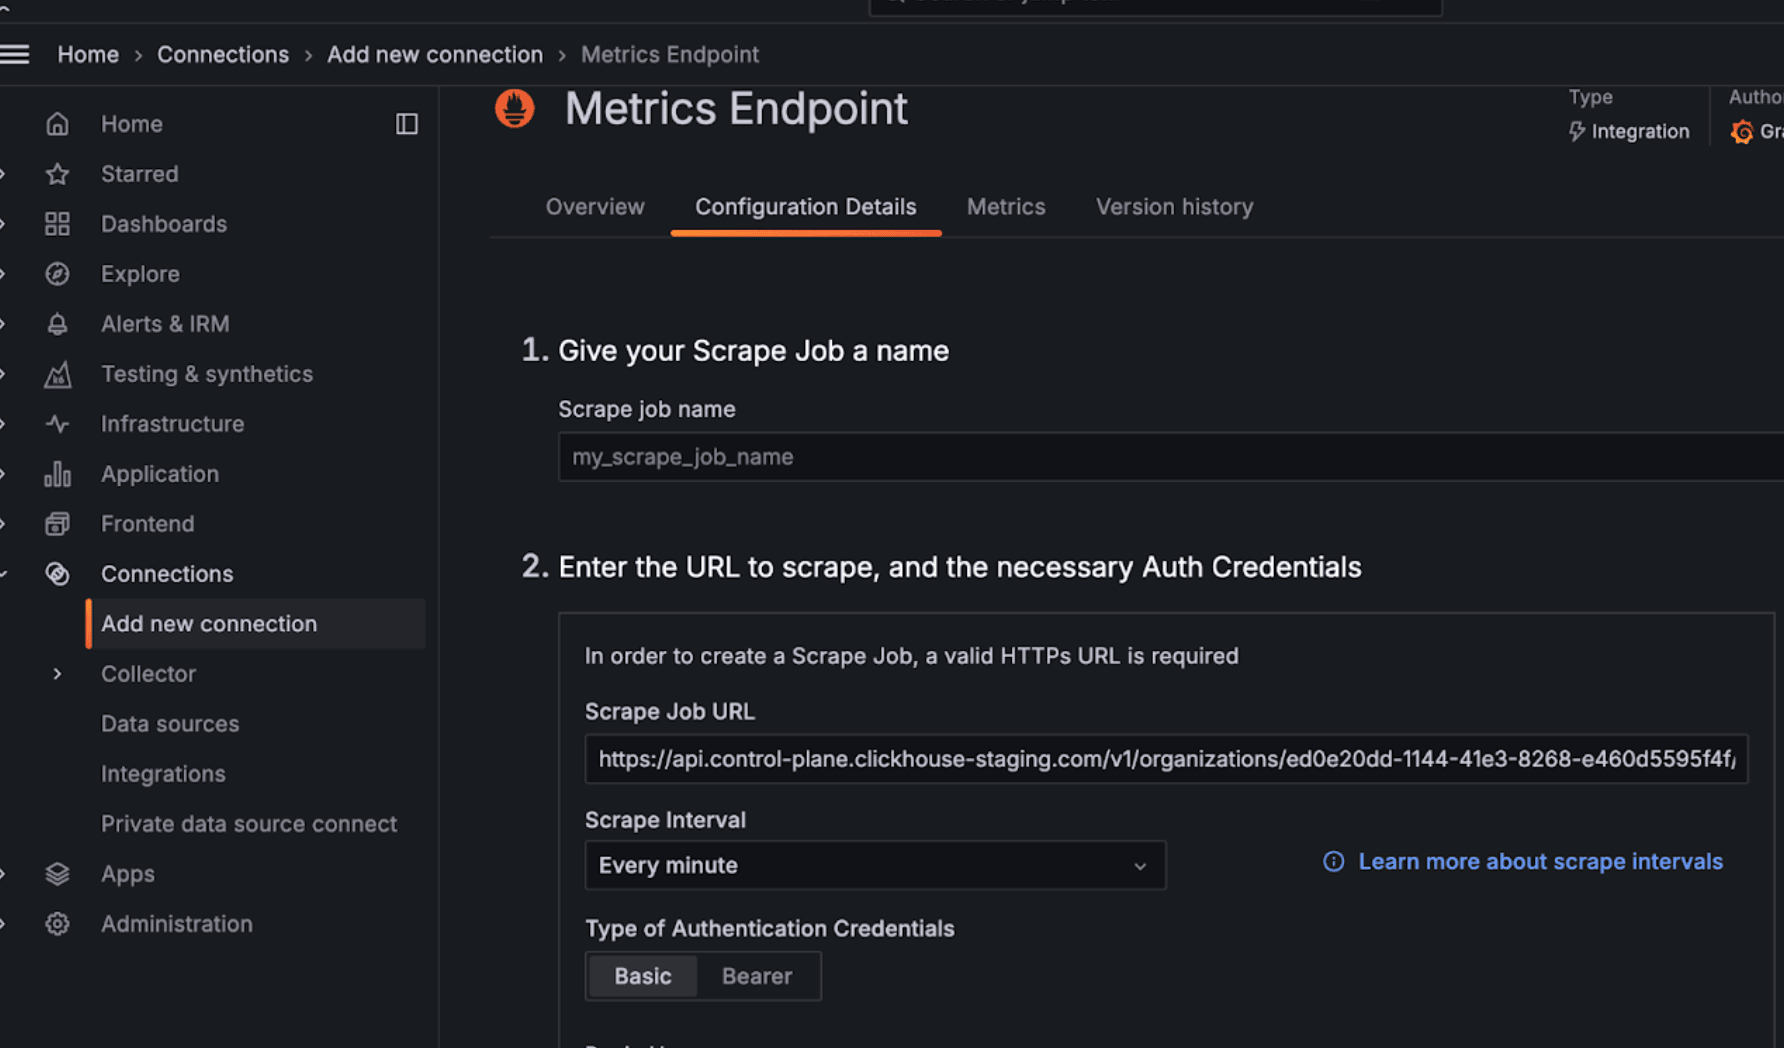
- Login to your Grafana Cloud account
- Add a new connection by selecting the Metrics Endpoint
- Configure the Scrape URL to point to the Prometheus endpoint and use basic auth to configure your connection with the API key/secret
- Test the connection to ensure you’re able to connect
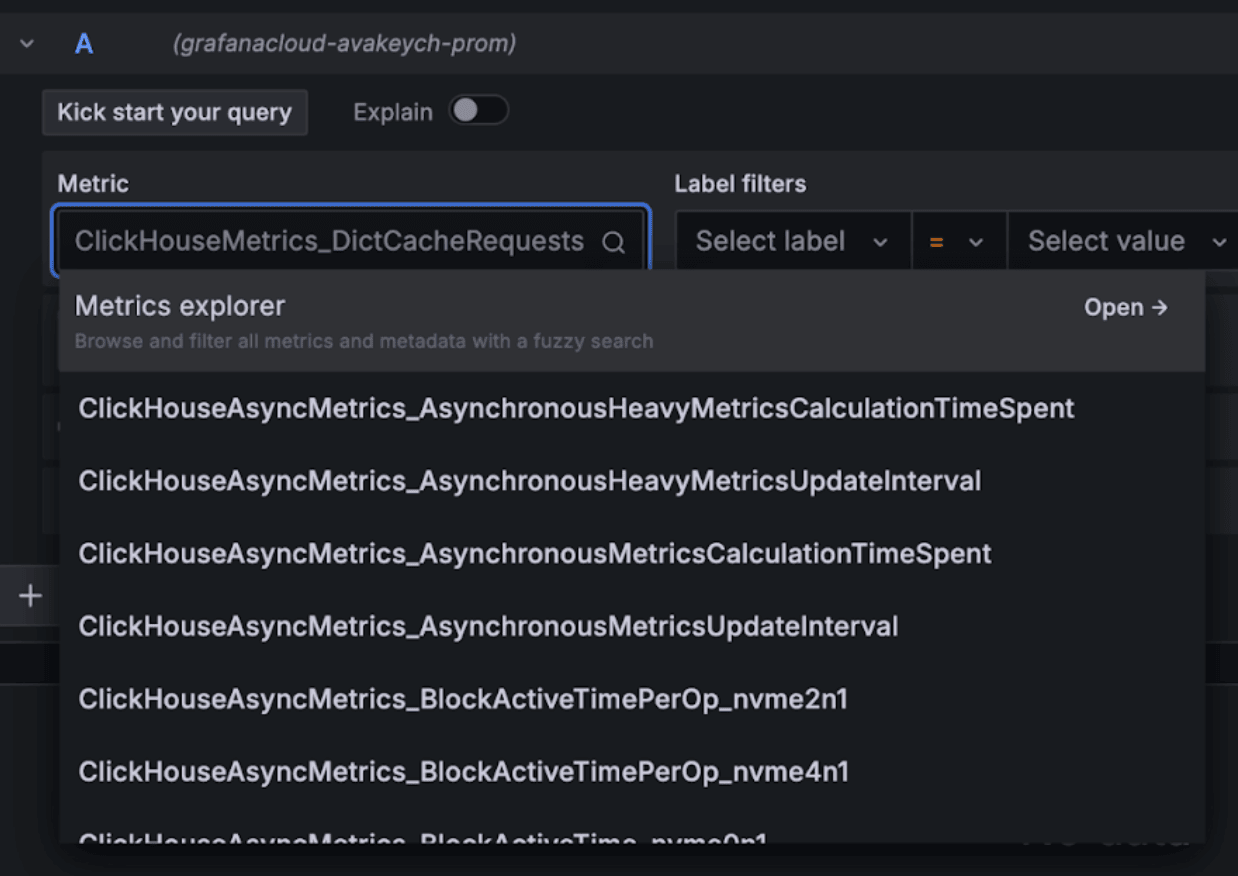
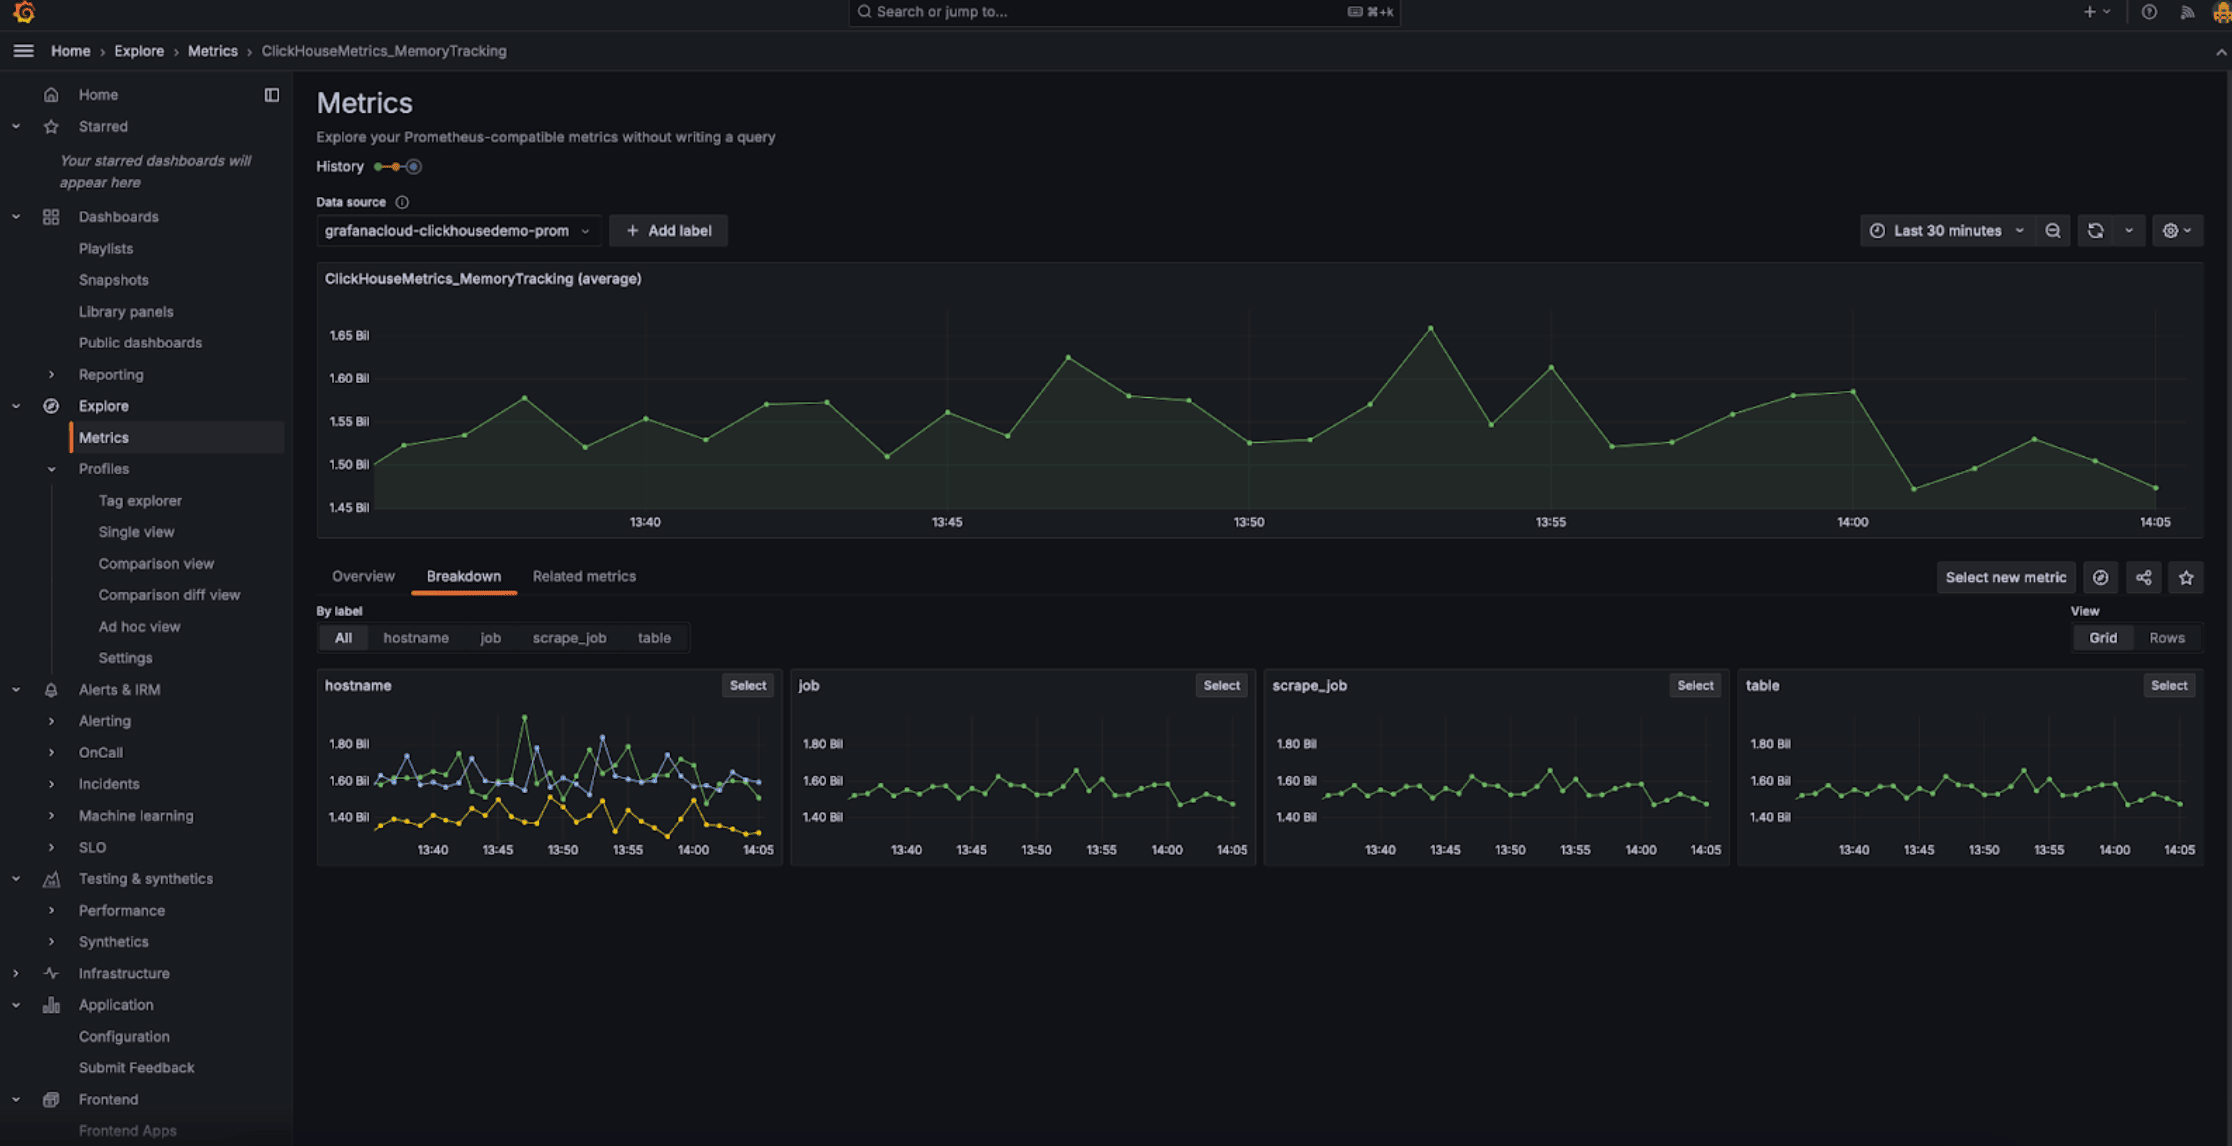
Once configured, you should see the metrics in the drop-down that you can select to configure dashboards:
Grafana Cloud with Alloy
If you’re using Grafana Cloud, Alloy can be installed by navigating to the Alloy menu in Grafana and following the onscreen instructions:
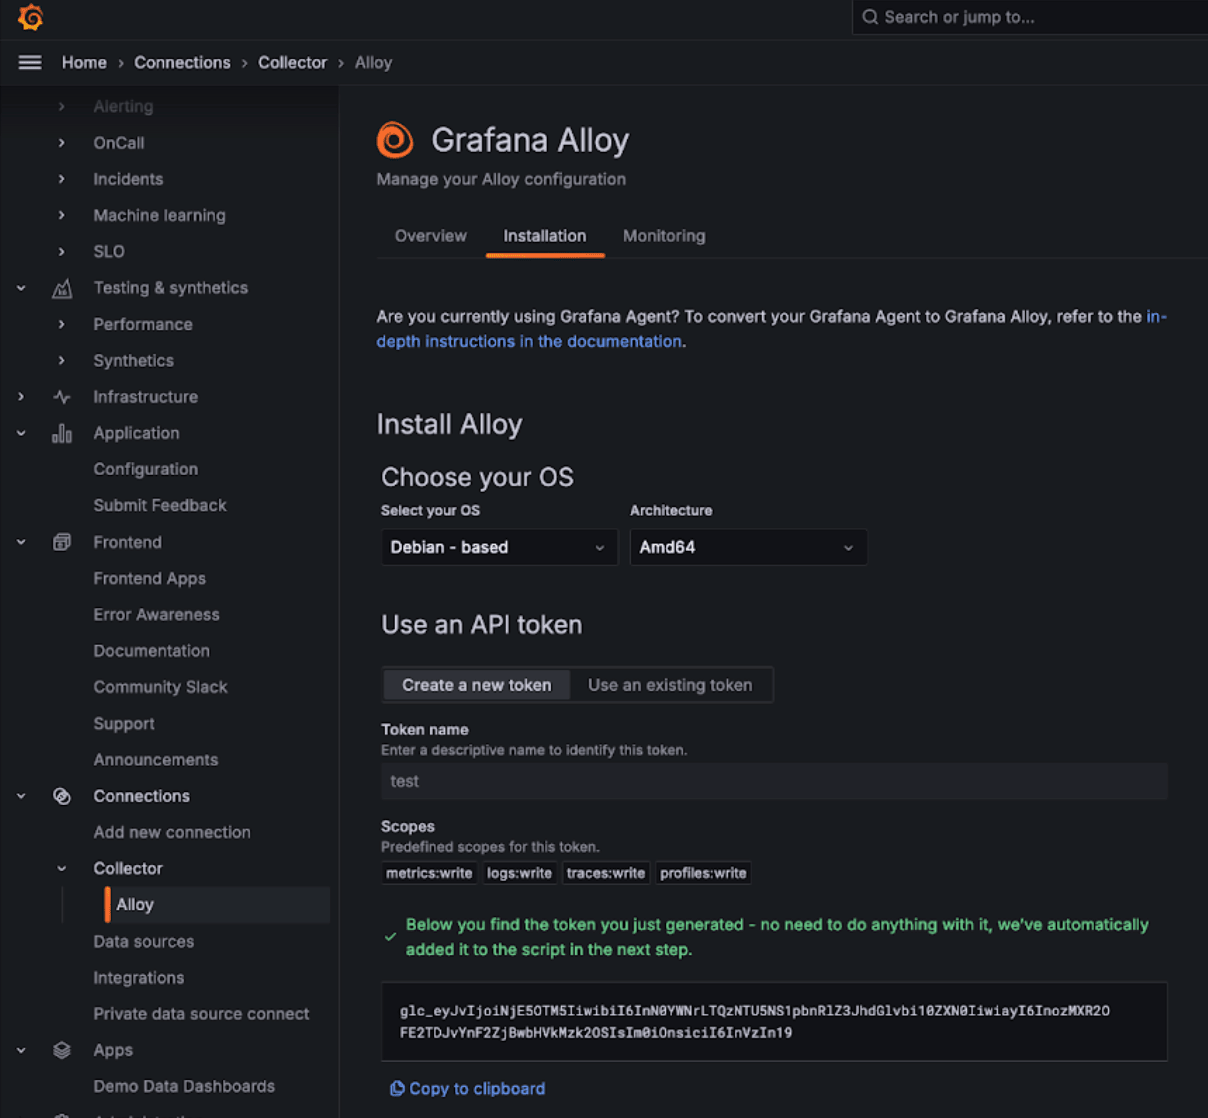
This should configure Alloy with a prometheus.remote_write component for sending data to a Grafana Cloud endpoint with an authentication token. Users then need to only modify the Alloy config (found in /etc/alloy/config.alloy for Linux) to include a scraper for the ClickHouse Cloud Prometheus Endpoint.
The following shows an example configuration for Alloy with a prometheus.scrape component for scraping metrics from the ClickHouse Cloud Endpoint, as well as the automatically configured prometheus.remote_write component. Note that the basic_auth configuration component contains our Cloud API key ID and secret as the username and password, respectively.
prometheus.scrape "clickhouse_cloud" {
  targets = [{
  __address__ = "api.clickhouse.cloud",
  }]

  scheme       = "https"
  metrics_path = "/v1/organizations/<clickhouse_org_id>/prometheus"

  params = {
  "filtered_metrics" = ["true"],
  }

  honor_labels    = true
  scrape_interval = "30s"
  scrape_timeout  = "25s"

  basic_auth {
  username = "<clickhouse_api_key_id>"
  password = "<clickhouse_api_key_secret>"
  }

  forward_to = [prometheus.remote_write.grafana_cloud.receiver]
}

  prometheus.remote_write "grafana_cloud" {
  endpoint {
  url = "https://<grafana_prometheus_url>/api/prom/push"

  basic_auth {
  username = "<grafana_username>"
  password = "<grafana_api_token>"
  }
  }
}
Note the honor_labels configuration parameter needs to be set to true for the instance label to be properly populated.
Grafana self-managed with Alloy
Self-managed users of Grafana can find the instructions for installing the Alloy agent here. We assume users have configured Alloy to send Prometheus metrics to their desired destination. The prometheus.scrape component below causes Alloy to scrape the ClickHouse Cloud Endpoint. We assume prometheus.remote_write receives the scraped metrics. Adjust the forward_to key to the target destination if this doesn’t exist.
// prometheus.scrape component causes Alloy to scrape the ClickHouse Cloud Prometheus endpoint.
  // Adjust the forward_to key to match your remote_write receiver if it differs.
  prometheus.scrape "clickhouse_cloud" {
  targets = [{
  __address__ = "api.clickhouse.cloud",
  }]

  scheme       = "https"
  metrics_path = "/v1/organizations/<organizationId>/prometheus"

  params = {
  "filtered_metrics" = ["true"],
  }

  honor_labels = true

  basic_auth {
  username = "<KEY_ID>"
  password = "<KEY_SECRET>"
  }

  forward_to = [prometheus.remote_write.metrics_service.receiver]
}
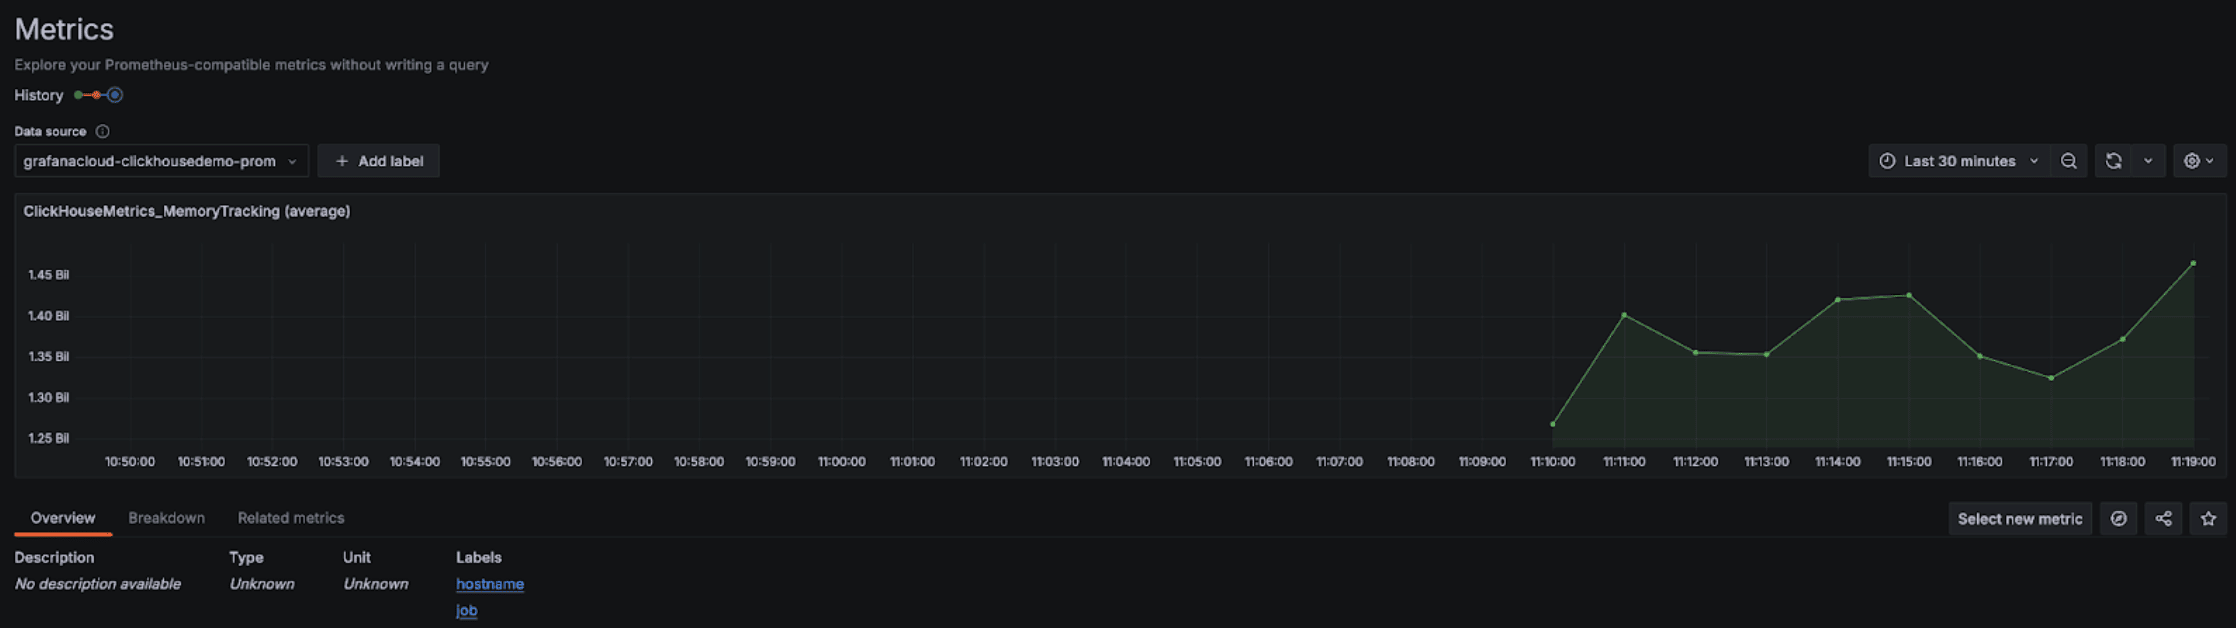
Once configured, you should see ClickHouse related metrics in your metrics explorer:
Note the honor_labels configuration parameter needs to be set to true for the instance label to be properly populated.
Integrating with Datadog
You can use the Datadog Agent and OpenMetrics integration to collect metrics from the ClickHouse Cloud endpoint. Below is a simple example configuration for this agent and integration. Please note though that you may want to select only those metrics that you care about the most. The catch-all example below will export many thousands of metric-instance combinations which Datadog will treat as custom metrics.
init_config:

instances:
   - openmetrics_endpoint: 'https://api.clickhouse.cloud/v1/organizations/97a33bdb-4db3-4067-b14f-ce40f621aae1/prometheus?filtered_metrics=true'
     namespace: 'clickhouse'
     metrics:
         - '^ClickHouse.*'
     username: username
     password: password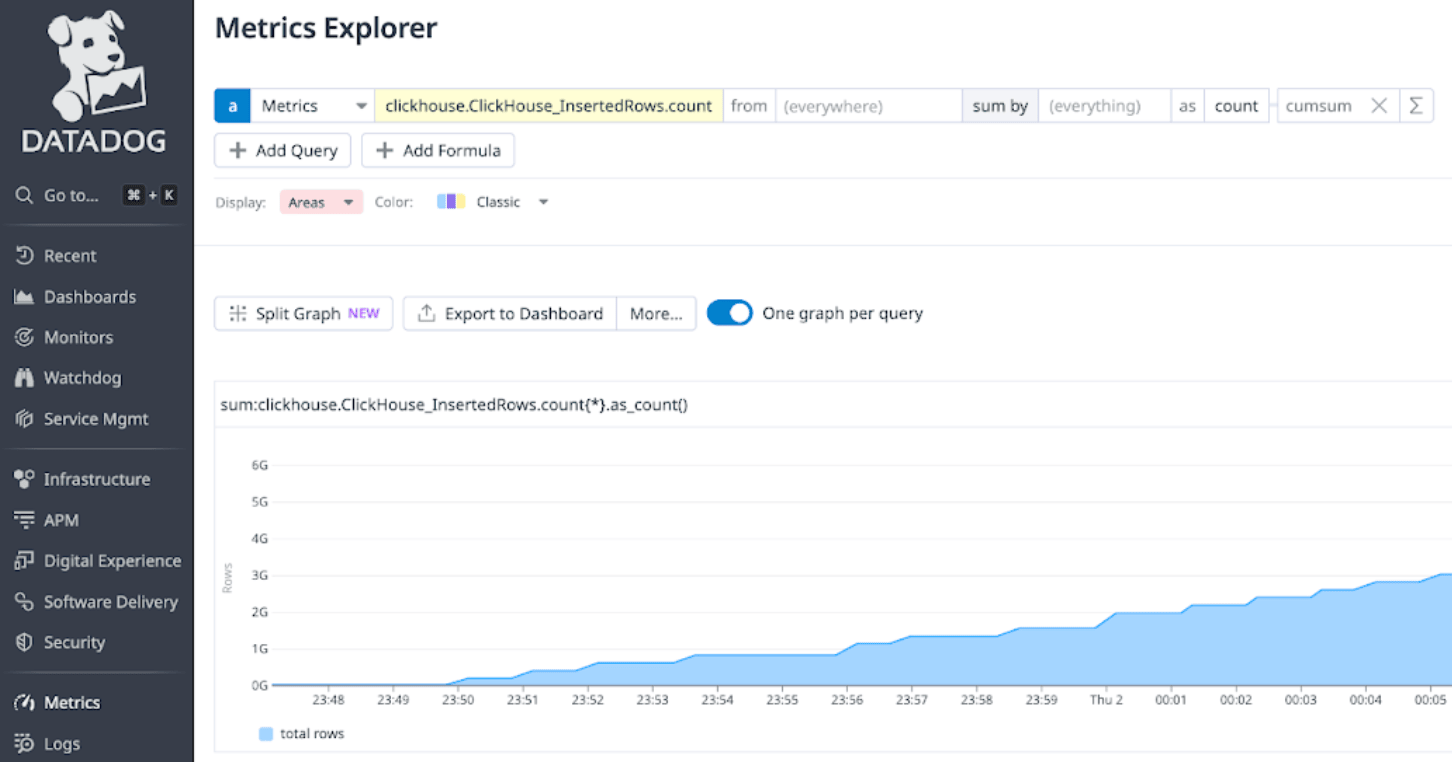
Related pages
- Monitoring overview — Compare all monitoring approaches for ClickHouse Cloud
- Cloud Console monitoring — Built-in dashboards that require no external tools
- Community and partner integrations — Datadog agent integration and community solutions
- Querying system tables — Direct SQL access to system metrics
- ClickHouse Managed Postgres Prometheus endpoint — Scrape metrics from your ClickHouse Managed Postgres services