

 Set up docs MCP
Integration with existing JVM application
This section covers configuring your existing JVM application to send metrics to ClickStack using the OpenTelemetry Java agent.
If you would like to test the integration before configuring your production setup, you can test with our demo dataset in the demo dataset section.
Prerequisites
- ClickStack instance running
- Existing Java application (Java 8+)
- Access to modify JVM startup arguments
Get ClickStack API key
The OpenTelemetry Java agent sends data to ClickStack’s OTLP endpoint, which requires authentication.
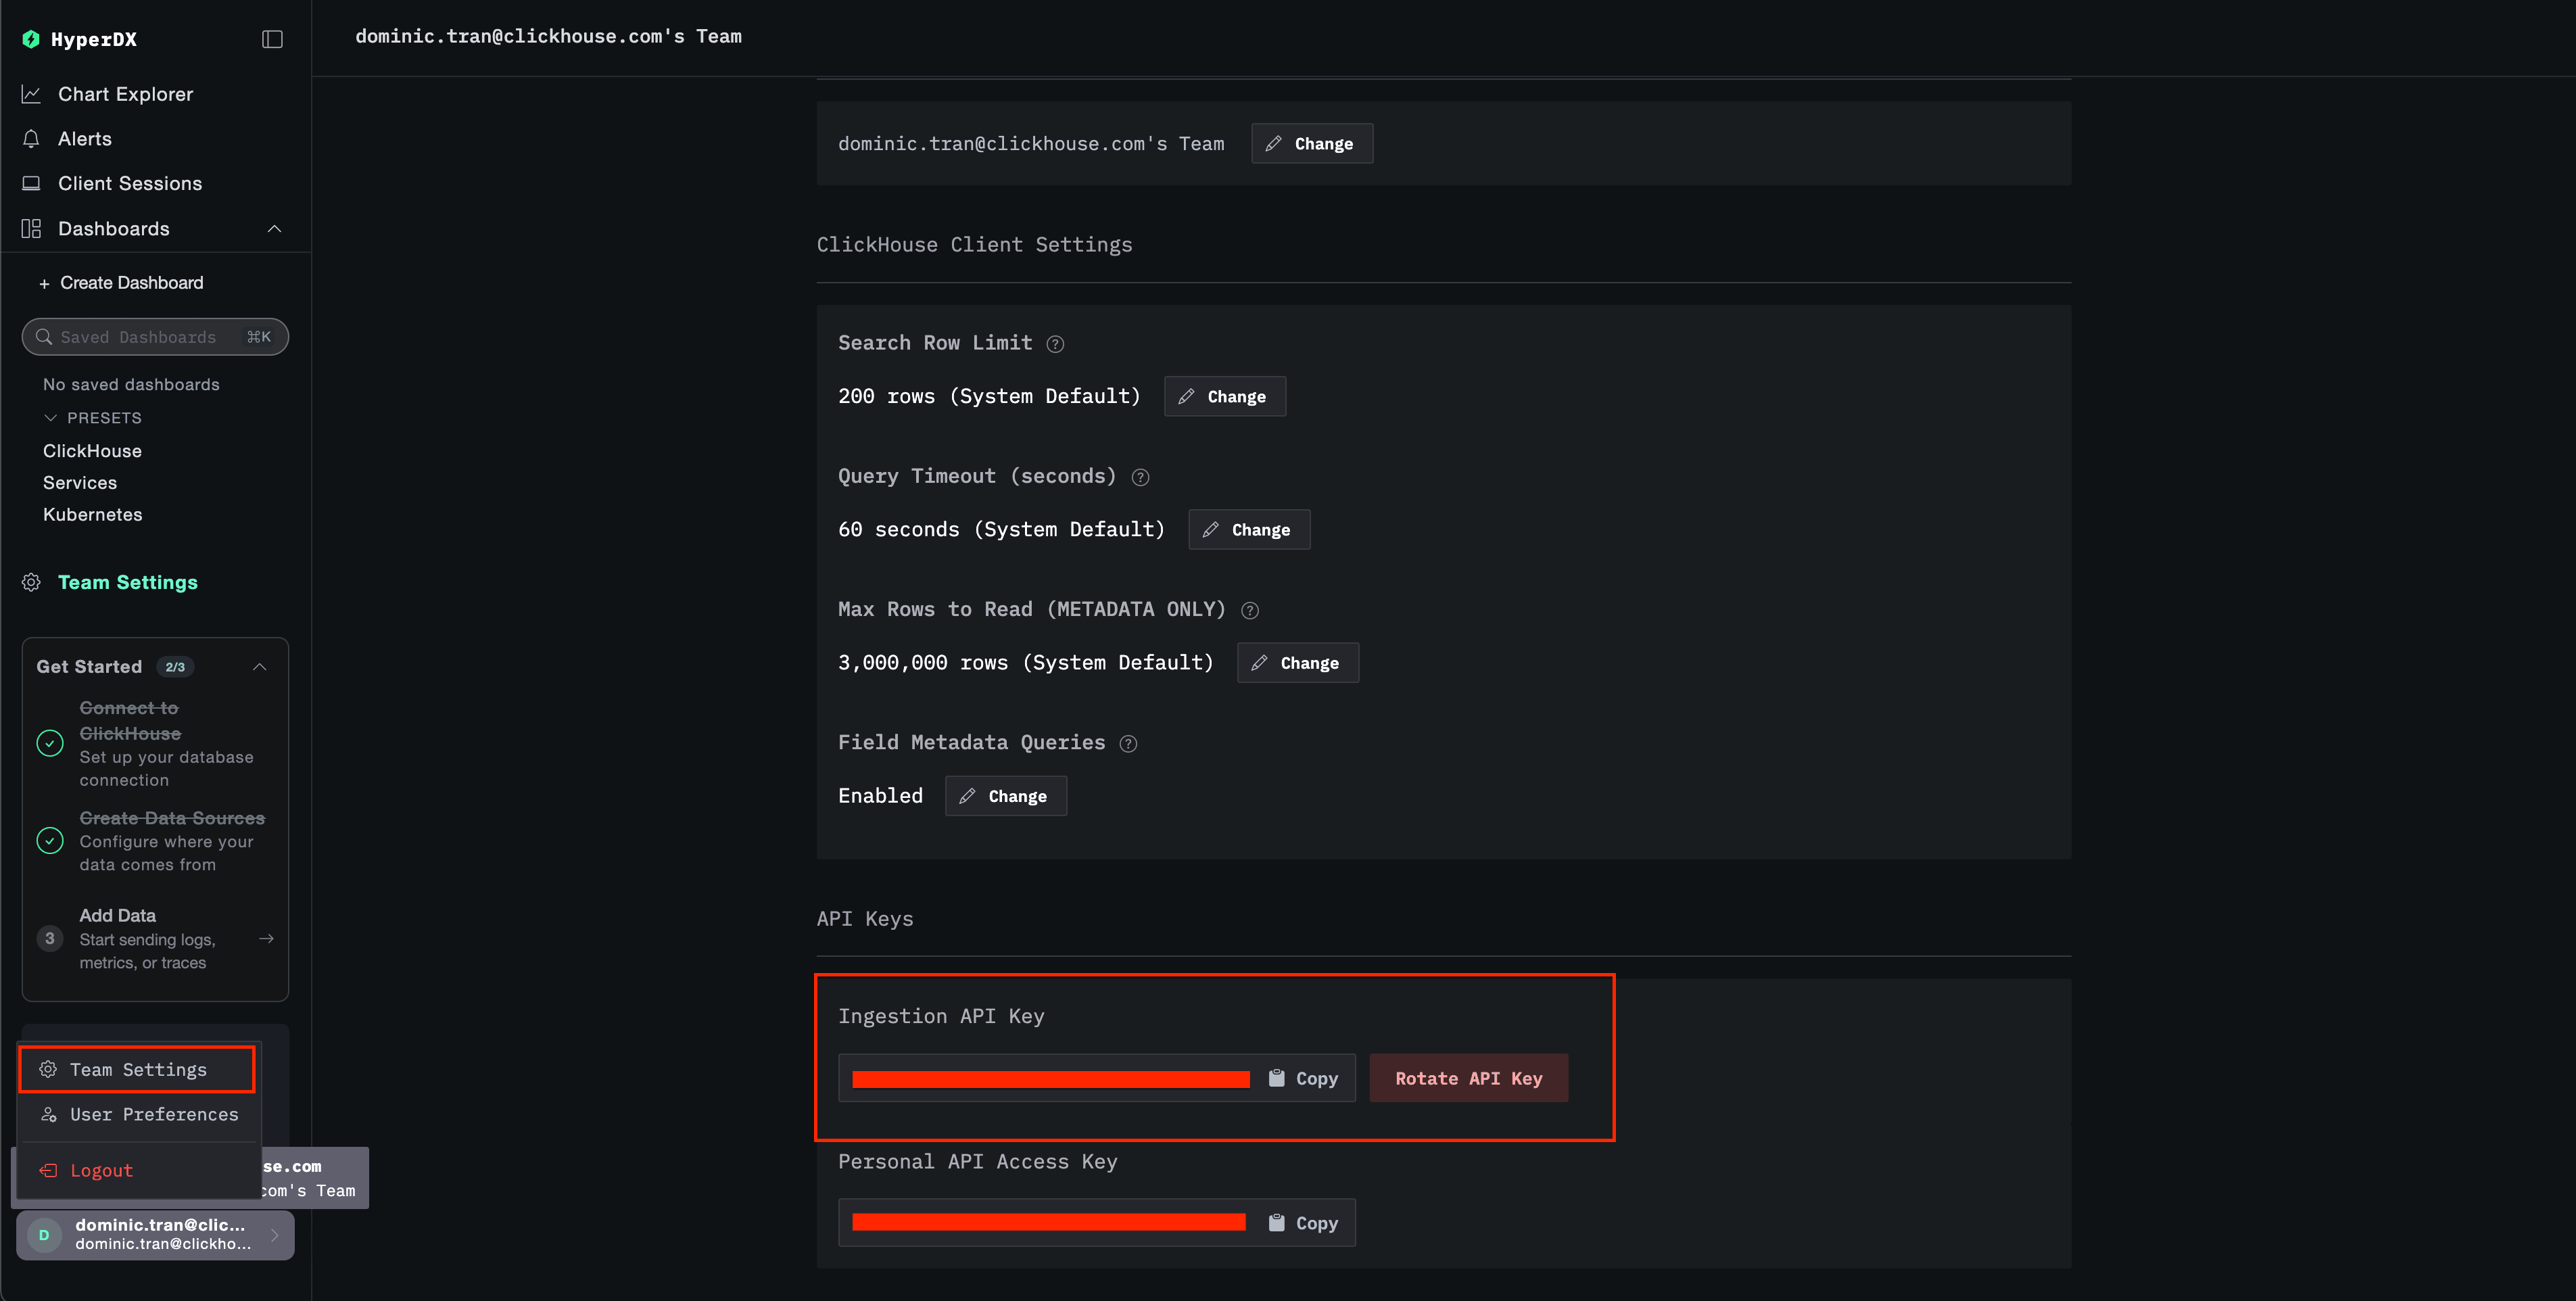
- Open HyperDX at your ClickStack URL (e.g., http://localhost:8080)
- Create an account or log in if needed
- Navigate to Team Settings → API Keys
- Copy your Ingestion API Key
Download OpenTelemetry Java agent
Download the OpenTelemetry Java agent JAR file:
curl -L -O https://github.com/open-telemetry/opentelemetry-java-instrumentation/releases/download/v2.22.0/opentelemetry-javaagent.jarThis downloads the agent to your current directory. You can place it wherever makes sense for your deployment (e.g., /opt/opentelemetry/ or alongside your application JAR).
Configure JVM startup arguments
Add the Java agent to your JVM startup command. The agent automatically collects JVM metrics and sends them to ClickStack.
Option 1: Command line flags
java -javaagent:opentelemetry-javaagent.jar \
  -Dotel.service.name=my-java-app \
  -Dotel.exporter.otlp.endpoint=http://localhost:4318 \
  -Dotel.exporter.otlp.protocol=http/protobuf \
  -Dotel.exporter.otlp.headers="authorization=YOUR_API_KEY" \
  -Dotel.metrics.exporter=otlp \
  -Dotel.logs.exporter=none \
  -Dotel.traces.exporter=none \
  -jar my-application.jar
Replace the following:
opentelemetry-javaagent.jar→ Full path to the agent JAR (e.g.,/opt/opentelemetry/opentelemetry-javaagent.jar)my-java-app→ A meaningful name for your service (e.g.,payment-service,user-api)YOUR_API_KEY→ Your ClickStack API key from the command abovemy-application.jar→ Your application’s JAR file namehttp://localhost:4318→ Your ClickStack endpoint (uselocalhost:4318if ClickStack runs on the same machine, otherwise usehttp://your-clickstack-host:4318)
Option 2: Environment variables
Alternatively, use environment variables:
export JAVA_TOOL_OPTIONS="-javaagent:opentelemetry-javaagent.jar"
export OTEL_SERVICE_NAME="my-java-app"
export OTEL_EXPORTER_OTLP_ENDPOINT="http://localhost:4318"
export OTEL_EXPORTER_OTLP_PROTOCOL="http/protobuf"
export OTEL_EXPORTER_OTLP_HEADERS="authorization=YOUR_API_KEY"
export OTEL_METRICS_EXPORTER="otlp"
export OTEL_LOGS_EXPORTER="none"
export OTEL_TRACES_EXPORTER="none"

java -jar my-application.jar
Replace the following:
opentelemetry-javaagent.jar→ Full path to the agent JARmy-java-app→ Your service nameYOUR_API_KEY→ Your ClickStack API keyhttp://localhost:4318→ Your ClickStack endpointmy-application.jar→ Your application’s JAR file name
Verify metrics in HyperDX
Once your application is running with the agent, verify metrics are flowing to ClickStack:
- Open HyperDX at http://localhost:8080 (or your ClickStack URL)
- Navigate to Chart Explorer
- Search for metrics starting with
jvm.(e.g.,jvm.memory.used,jvm.gc.duration,jvm.thread.count)
Demo dataset
For users who want to test the JVM metrics integration before instrumenting their applications, we provide a sample dataset with pre-generated metrics showing realistic JVM behavior from a medium-sized microservice with steady moderate traffic.
Download the sample dataset
# Download gauge metrics (memory, threads, CPU, classes)
curl -O https://datasets-documentation.s3.eu-west-3.amazonaws.com/clickstack-integrations/jvm/jvm-metrics-gauge.jsonl

# Download sum metrics (GC events)
curl -O https://datasets-documentation.s3.eu-west-3.amazonaws.com/clickstack-integrations/jvm/jvm-metrics-sum.jsonl
The dataset includes 24 hours of JVM metrics showing:
- Heap memory growth with periodic garbage collection events
- Thread count variations
- Realistic GC pause times
- Class loading activity
- CPU utilization patterns
Start ClickStack
If you don’t already have ClickStack running:
docker run -d --name clickstack \
  -p 8080:8080 -p 4317:4317 -p 4318:4318 \
  clickhouse/clickstack-all-in-one:latest
Wait a few moments for ClickStack to fully start up.
Import the demo dataset
# Import gauge metrics (memory, threads, CPU, classes)
docker exec -i clickstack clickhouse-client --query="
  INSERT INTO default.otel_metrics_gauge FORMAT JSONEachRow
" < jvm-metrics-gauge.jsonl

# Import sum metrics (GC events)
docker exec -i clickstack clickhouse-client --query="
  INSERT INTO default.otel_metrics_sum FORMAT JSONEachRow
" < jvm-metrics-sum.jsonl
This imports the metrics directly into ClickStack’s metrics tables.
Verify the demo data
Once imported:
- Open HyperDX at http://localhost:8080 and log in (create an account if needed)
- Navigate to the Search view and set source to Metrics
- Set the time range to 2025-12-06 14:00:00 - 2025-12-09 14:00:00
- Search for
jvm.memory.usedorjvm.gc.duration
You should see metrics for the demo service.
Dashboards and visualization
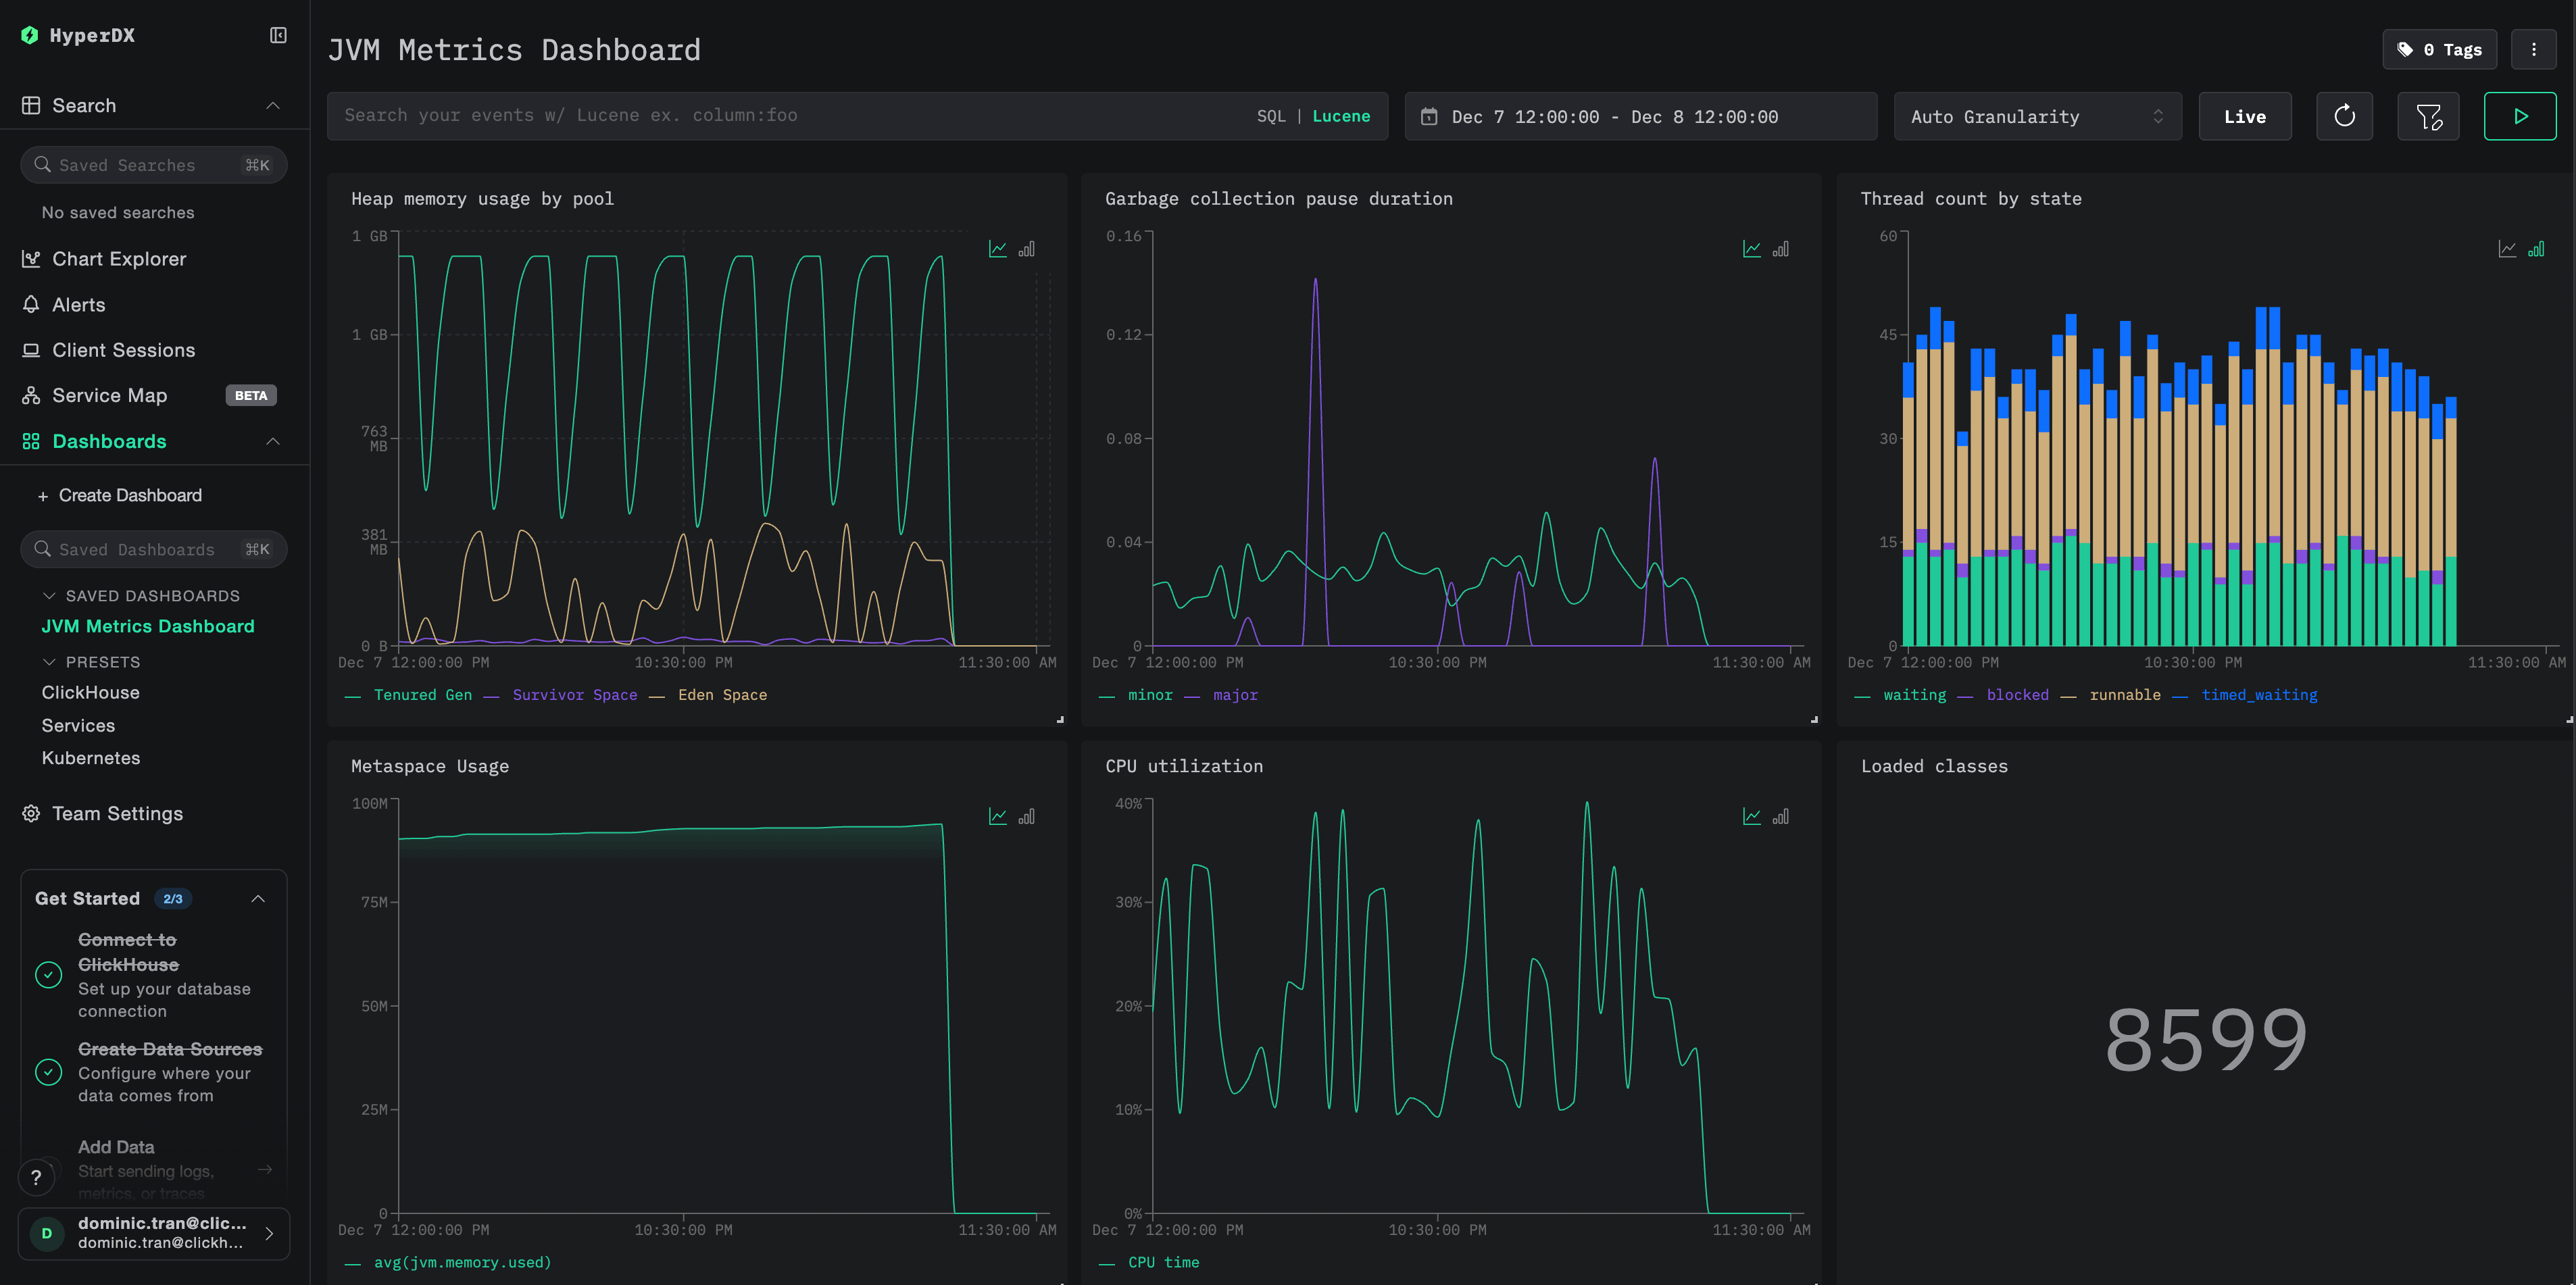
To help you monitor JVM applications with ClickStack, we provide a pre-built dashboard with essential visualizations for JVM metrics.
Download the dashboard configuration
Import the pre-built dashboard
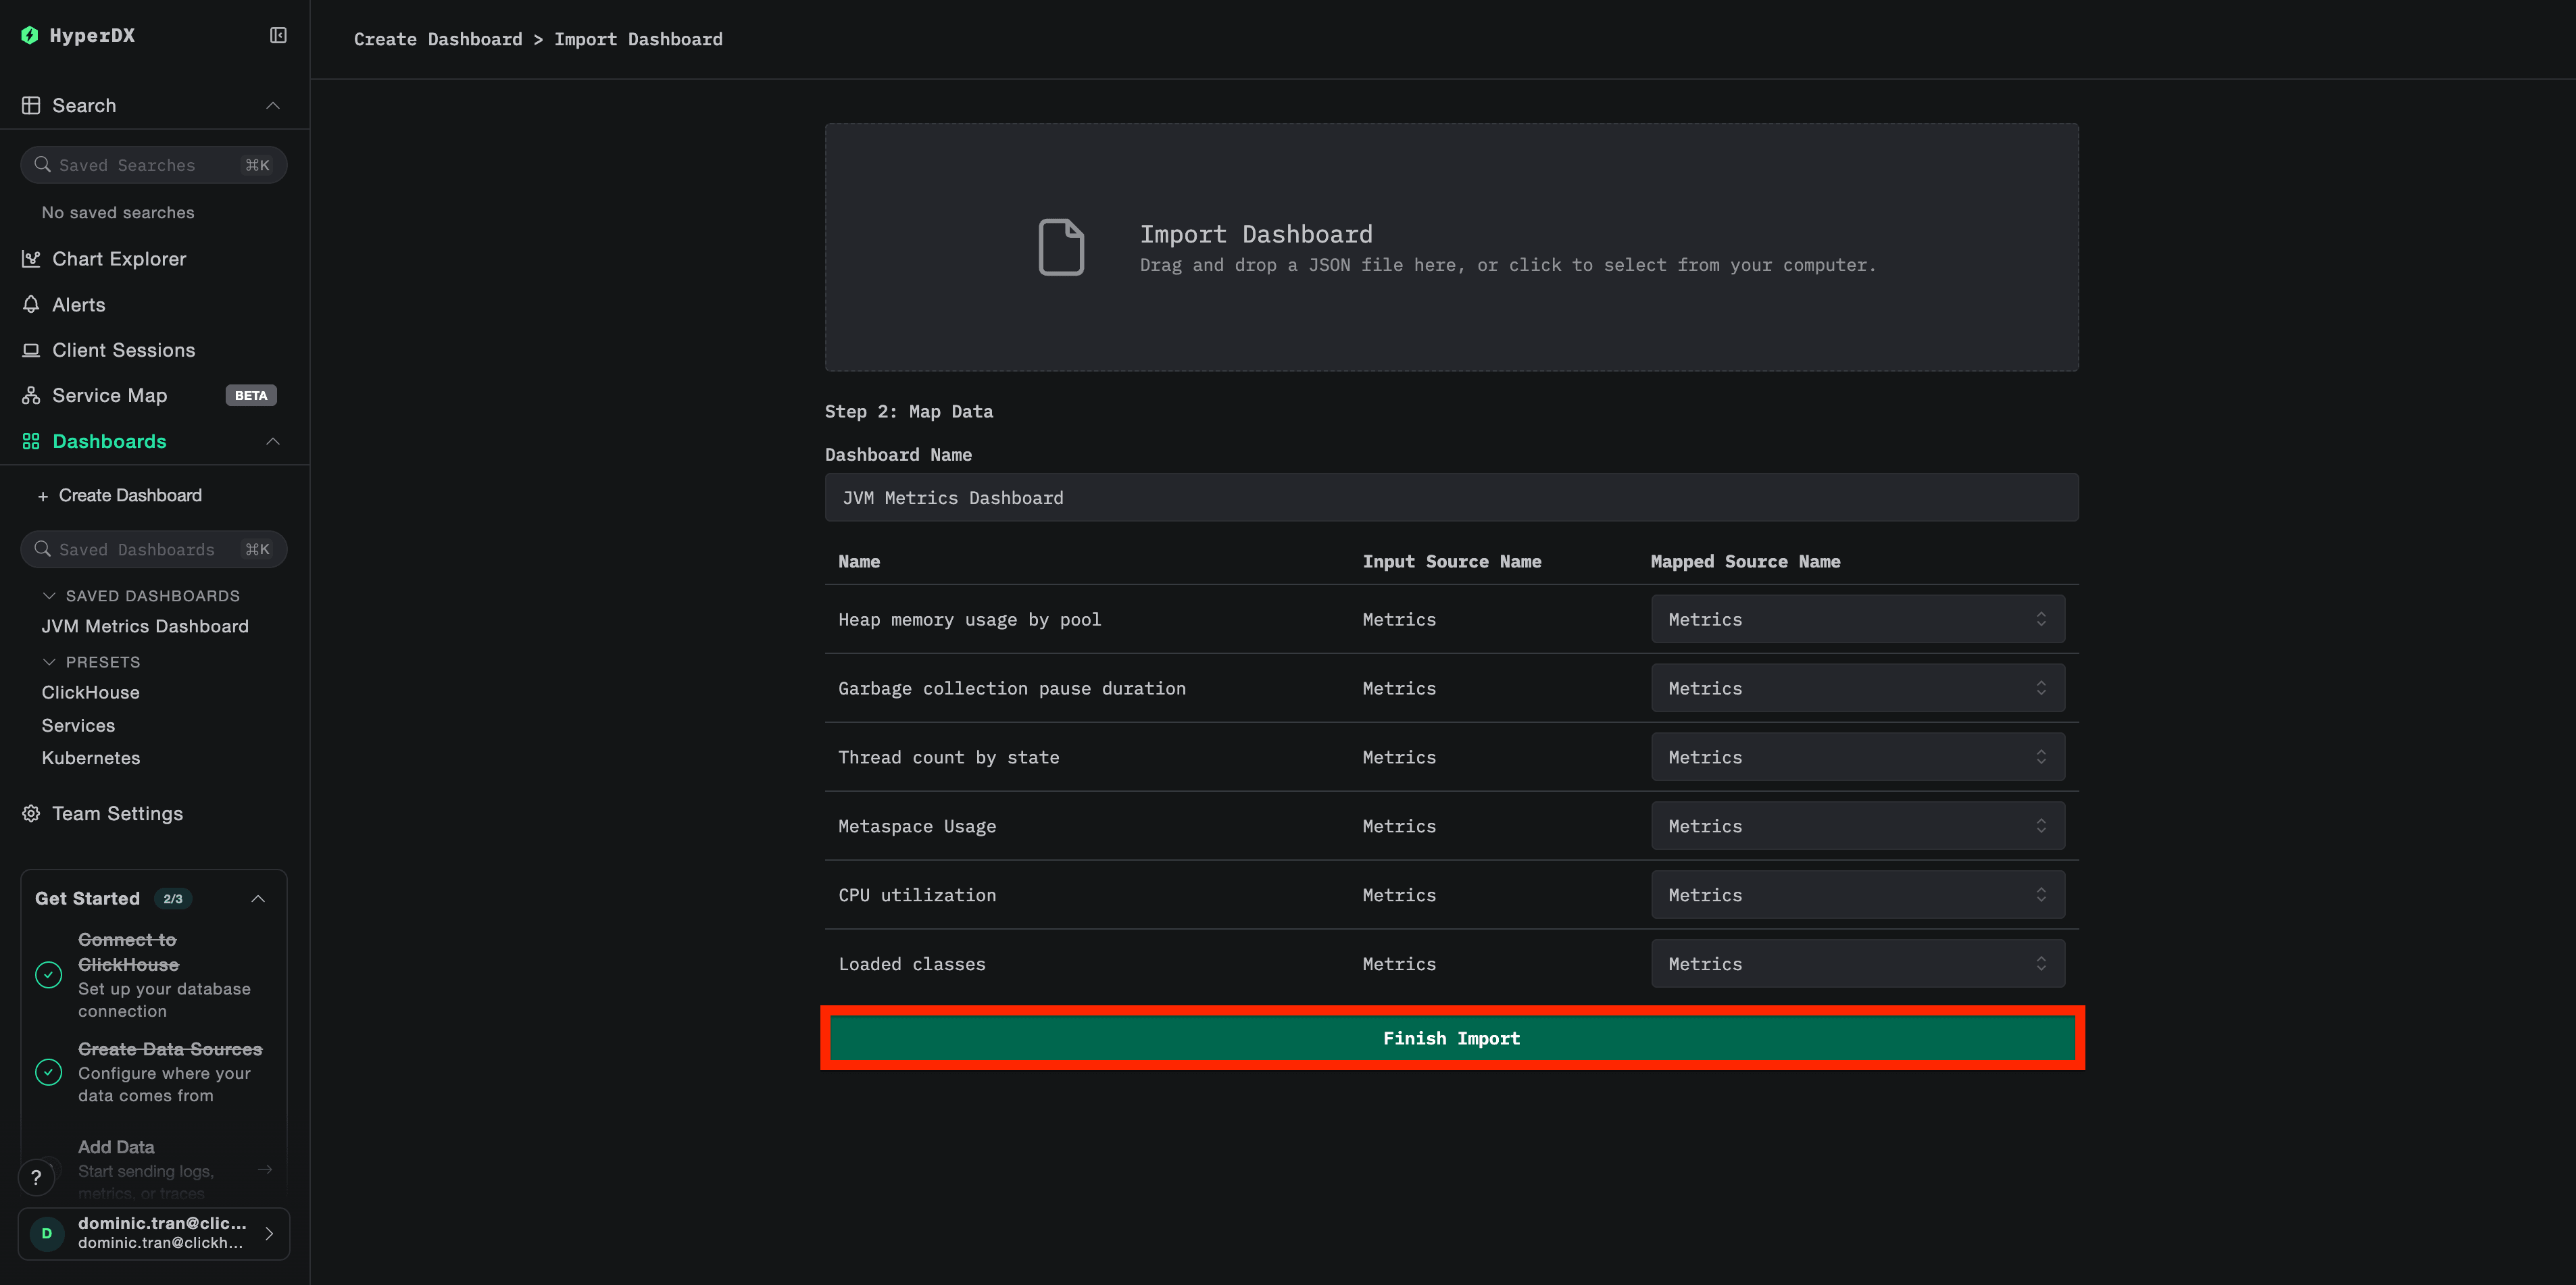
- Open HyperDX and navigate to the Dashboards section
- Click Import Dashboard in the upper right corner under the ellipses

- Upload the
jvm-metrics-dashboard.jsonfile and click Finish Import
View the dashboard
The dashboard will be created with all visualizations pre-configured:
Troubleshooting
Agent not starting
Verify the agent JAR exists:
ls -lh /path/to/opentelemetry-javaagent.jarCheck Java version compatibility (requires Java 8+):
java -versionLook for agent startup log message: When your application starts, you should see:
[otel.javaagent] OpenTelemetry Javaagent v2.22.0 startedNo metrics appearing in HyperDX
Verify ClickStack is running and accessible:
docker ps | grep clickstack
curl -v http://localhost:4318/v1/metrics
Check that metrics exporter is configured:
# If using environment variables, verify:
echo $OTEL_METRICS_EXPORTER
# Should output: otlp
Check application logs for OpenTelemetry errors: Look for any error messages related to OpenTelemetry or OTLP export failures in your application logs.
Verify network connectivity: If ClickStack is on a remote host, ensure port 4318 is accessible from your application server.
Verify agent version: Ensure you’re using the latest stable agent version (currently 2.22.0), as newer versions often include performance improvements.
Next steps
- Set up alerts for critical metrics like high heap usage, frequent GC pauses, or thread exhaustion
- Explore other ClickStack integrations to unify your observability data
Going to production
This guide demonstrates configuring the OpenTelemetry Java agent for local testing. For production deployments, include the agent JAR in your container images and configure via environment variables for easier management. For larger environments with many JVM instances, deploy a centralized OpenTelemetry Collector to batch and forward metrics from multiple applications instead of sending directly to ClickStack.
See Ingesting with OpenTelemetry for production deployment patterns and collector configuration examples.