

 Set up docs MCP
Integration with existing PostgreSQL
This section covers configuring your existing PostgreSQL installation to send logs to ClickStack by modifying the ClickStack OTel collector configuration.
If you would like to test the PostgreSQL logs integration before configuring your own existing setup, you can test with our preconfigured setup and sample data in the “Demo dataset” section.
Prerequisites
- ClickStack instance running
- Existing PostgreSQL installation (version 9.6 or newer)
- Access to modify PostgreSQL configuration files
- Sufficient disk space for log files
Configure PostgreSQL logging
PostgreSQL supports multiple log formats. For structured parsing with OpenTelemetry, we recommend CSV format which provides consistent, parseable output.
The postgresql.conf file is typically located at:
- Linux (apt/yum):
/etc/postgresql/{version}/main/postgresql.conf - macOS (Homebrew):
/usr/local/var/postgres/postgresql.confor/opt/homebrew/var/postgres/postgresql.conf - Docker: Configuration is usually set via environment variables or mounted config file
Add or modify these settings in postgresql.conf:
# Required for CSV logging
logging_collector = on
log_destination = 'csvlog'

# Recommended: Connection logging
log_connections = on
log_disconnections = on

# Optional: Tune based on your monitoring needs
#log_min_duration_statement = 1000  # Log queries taking more than 1 second
#log_statement = 'ddl'               # Log DDL statements (CREATE, ALTER, DROP)
#log_checkpoints = on                # Log checkpoint activity
#log_lock_waits = on # Log lock contentionAfter making these changes, restart PostgreSQL:
# For systemd
sudo systemctl restart postgresql

# For Docker
docker restart
Verify logs are being written:
# Default log location on Linux
tail -f /var/lib/postgresql/{version}/main/log/postgresql-*.log

# macOS Homebrew
tail -f /usr/local/var/postgres/log/postgresql-*.log
Create custom OTel collector configuration
ClickStack allows you to extend the base OpenTelemetry Collector configuration by mounting a custom configuration file and setting an environment variable. The custom configuration is merged with the base configuration managed by HyperDX via OpAMP.
Create a file named postgres-logs-monitoring.yaml with the following configuration:
receivers:
  filelog/postgres:
    include:
      - /var/lib/postgresql/*/main/log/postgresql-*.csv # Adjust to match your PostgreSQL installation
    start_at: end
    multiline:
      line_start_pattern: '^\d{4}-\d{2}-\d{2} \d{2}:\d{2}:\d{2}'
    operators:
      - type: csv_parser
        parse_from: body
        parse_to: attributes
        header: 'log_time,user_name,database_name,process_id,connection_from,session_id,session_line_num,command_tag,session_start_time,virtual_transaction_id,transaction_id,error_severity,sql_state_code,message,detail,hint,internal_query,internal_query_pos,context,query,query_pos,location,application_name,backend_type,leader_pid,query_id'
        lazy_quotes: true

      - type: time_parser
        parse_from: attributes.log_time
        layout: '%Y-%m-%d %H:%M:%S.%L %Z'

      - type: add
        field: attributes.source
        value: "postgresql"

      - type: add
        field: resource["service.name"]
        value: "postgresql-production"

service:
  pipelines:
    logs/postgres:
      receivers: [filelog/postgres]
      processors:
        - memory_limiter
        - transform
        - batch
      exporters:
        - clickhouse
This configuration:
- Reads PostgreSQL CSV logs from their standard location
- Handles multi-line log entries (errors often span multiple lines)
- Parses CSV format with all standard PostgreSQL log fields
- Extracts timestamps to preserve original log timing
- Adds
source: postgresqlattribute for filtering in HyperDX - Routes logs to the ClickHouse exporter via a dedicated pipeline
Configure ClickStack to load custom configuration
To enable custom collector configuration in your existing ClickStack deployment, you must:
- Mount the custom config file at
/etc/otelcol-contrib/custom.config.yaml - Set the environment variable
CUSTOM_OTELCOL_CONFIG_FILE=/etc/otelcol-contrib/custom.config.yaml - Mount your PostgreSQL log directory so the collector can read them
Option 1: Docker Compose
Update your ClickStack deployment configuration:
services:
  clickstack:
    # ... existing configuration ...
    environment:
      - CUSTOM_OTELCOL_CONFIG_FILE=/etc/otelcol-contrib/custom.config.yaml
      # ... other environment variables ...
    volumes:
      - ./postgres-logs-monitoring.yaml:/etc/otelcol-contrib/custom.config.yaml:ro
      - /var/lib/postgresql:/var/lib/postgresql:ro
      # ... other volumes ...
Option 2: Docker Run (All-in-One Image)
If you’re using the all-in-one image with docker run:
docker run --name clickstack \
  -p 8080:8080 -p 4317:4317 -p 4318:4318 \
  -e CUSTOM_OTELCOL_CONFIG_FILE=/etc/otelcol-contrib/custom.config.yaml \
  -v "$(pwd)/postgres-logs-monitoring.yaml:/etc/otelcol-contrib/custom.config.yaml:ro" \
  -v /var/lib/postgresql:/var/lib/postgresql:ro \
clickhouse/clickstack-all-in-one:latestVerifying Logs in HyperDX
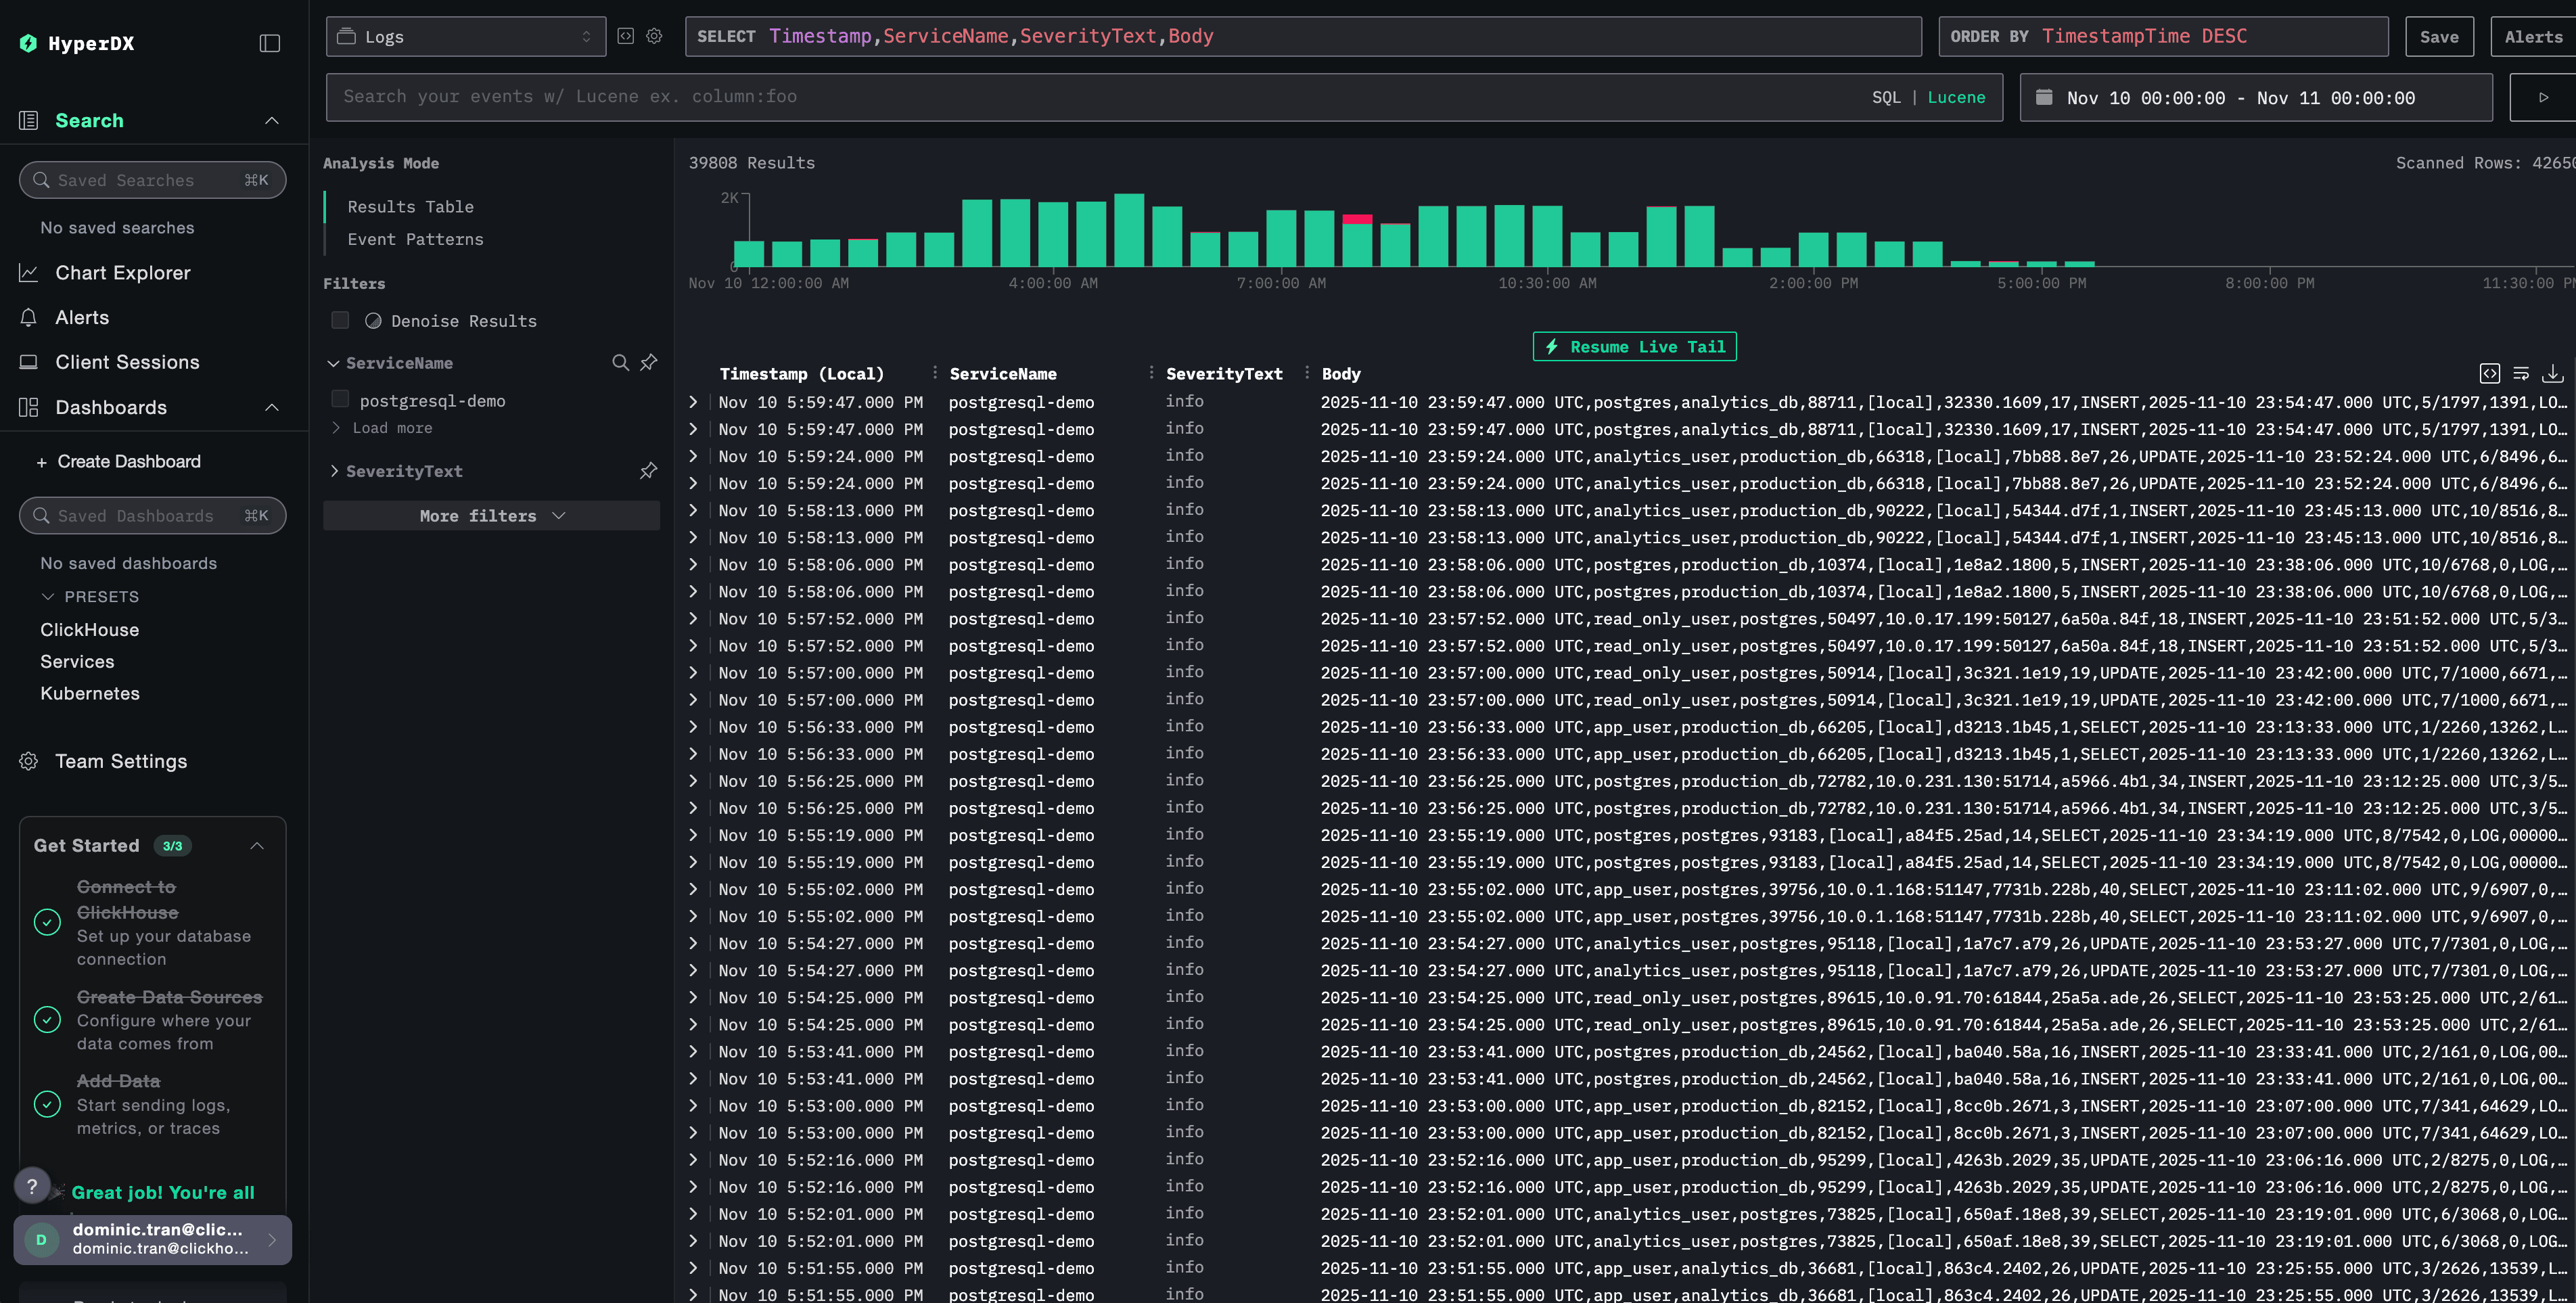
Once configured, log into HyperDX and verify logs are flowing:
- Navigate to the search view
- Set source to Logs
- Filter by
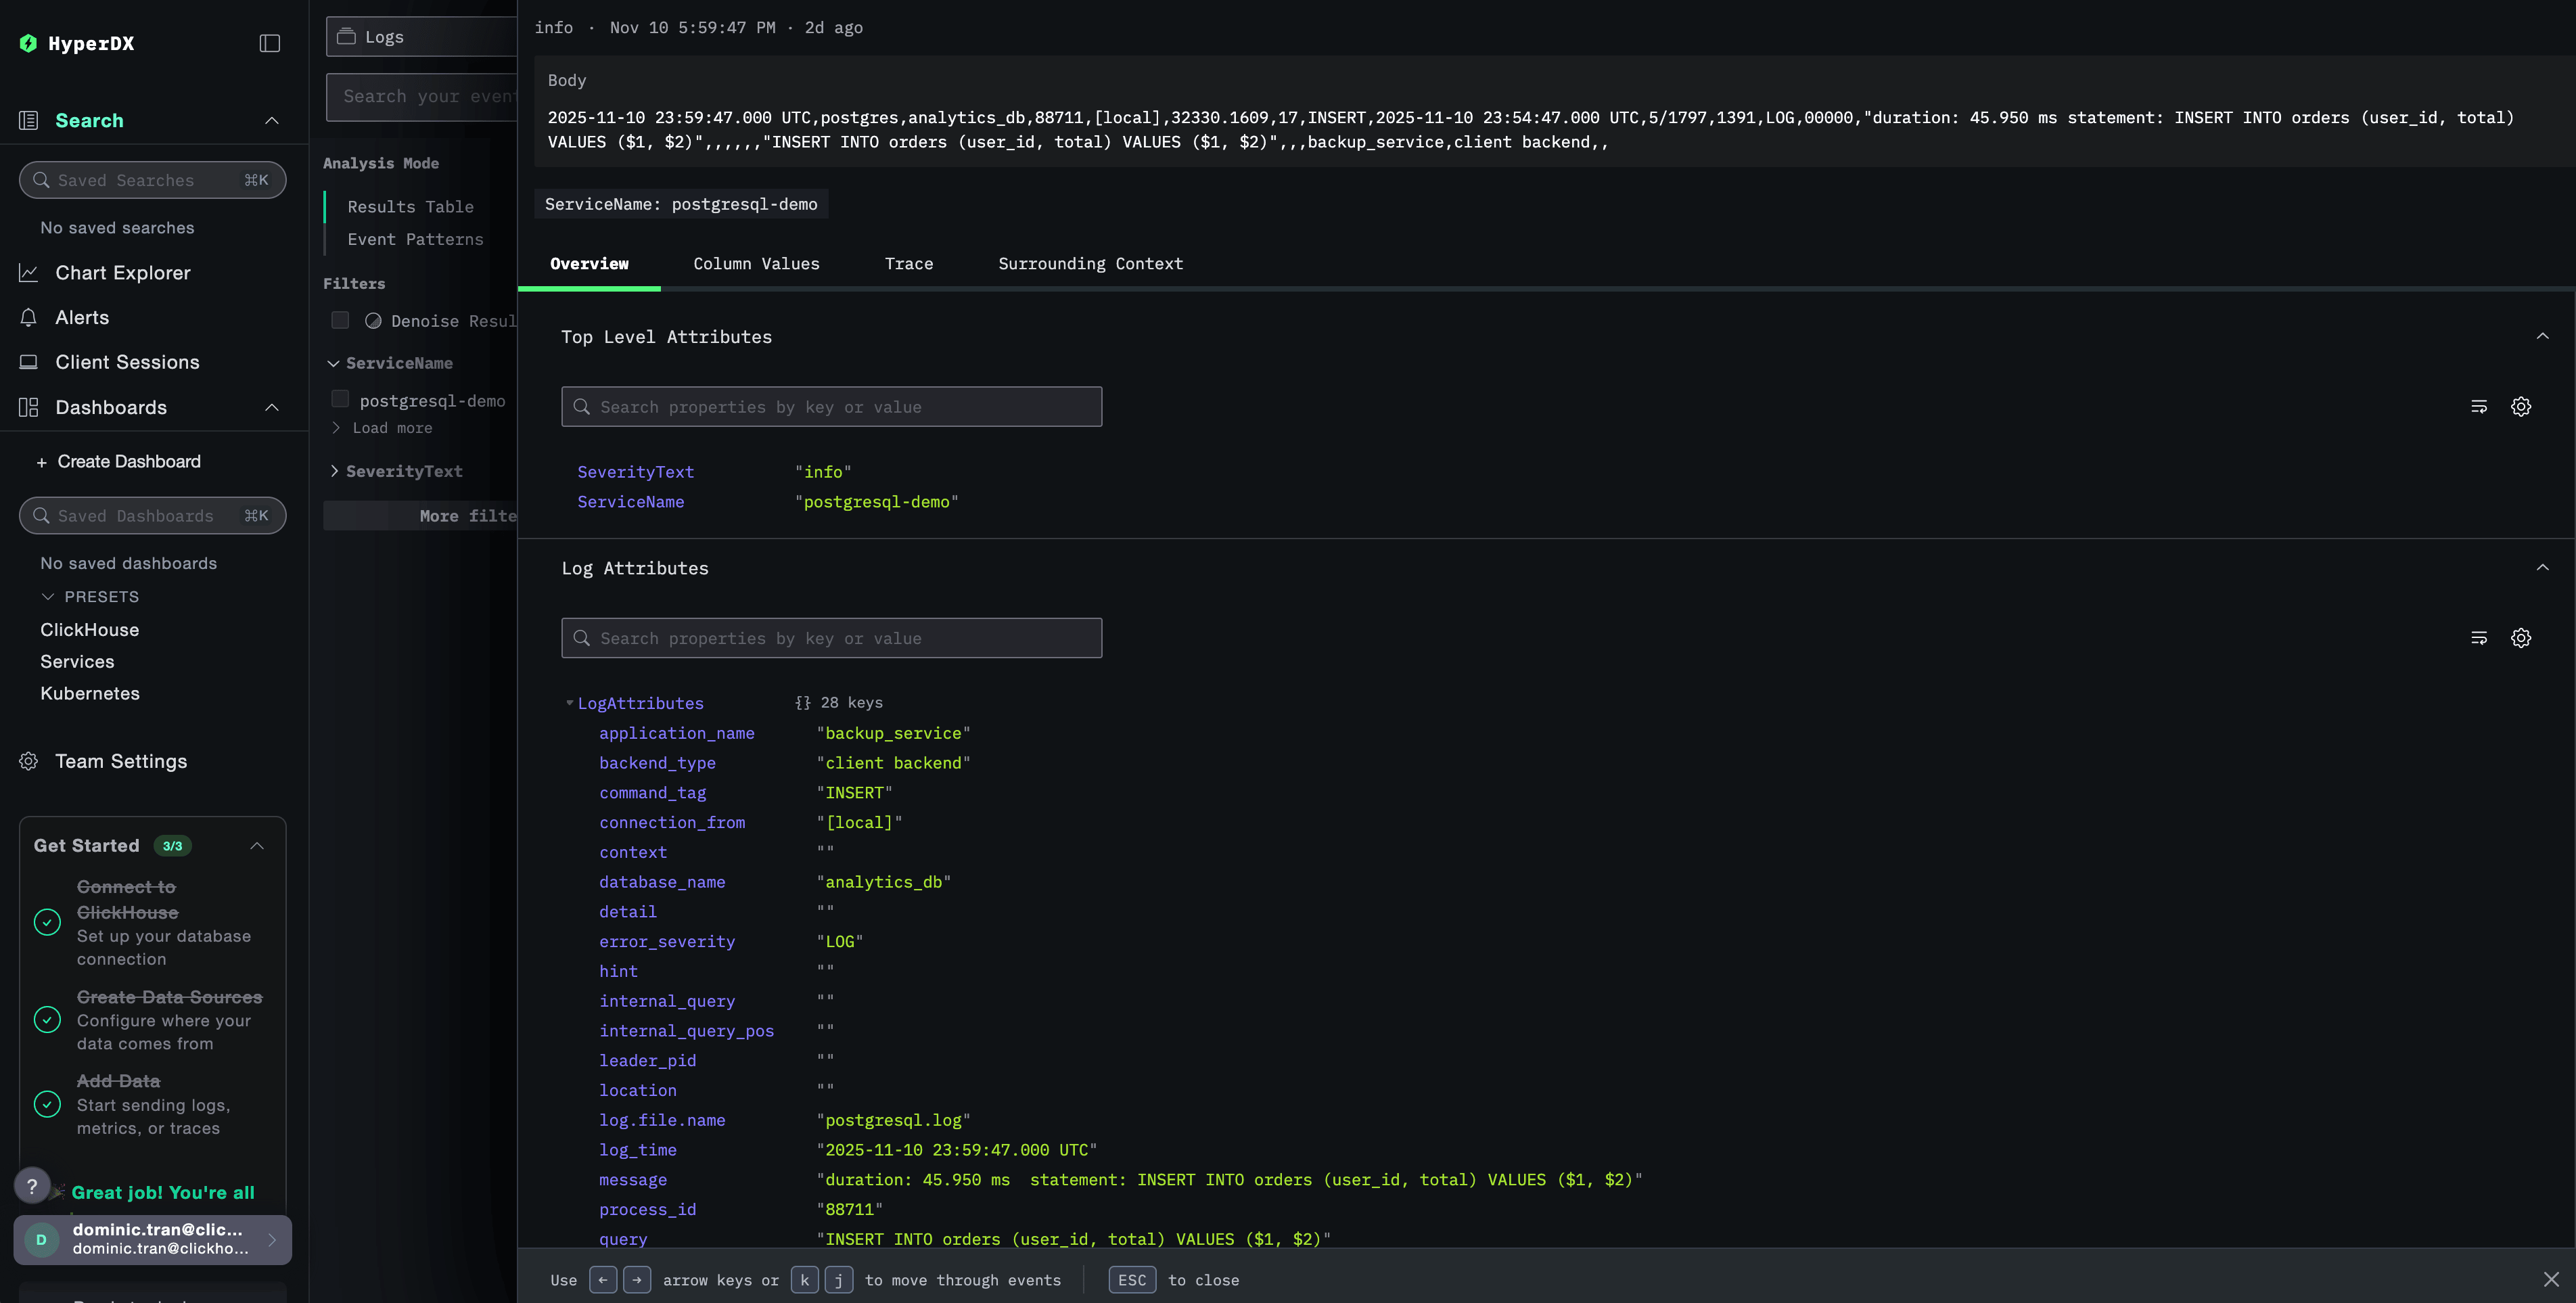
source:postgresqlto see PostgreSQL-specific logs - You should see structured log entries with fields like
user_name,database_name,error_severity,message,query, etc.
Demo dataset
For users who want to test the PostgreSQL logs integration before configuring their production systems, we provide a sample dataset of pre-generated PostgreSQL logs with realistic patterns.
Download the sample dataset
Download the sample log file:
curl -O https://datasets-documentation.s3.eu-west-3.amazonaws.com/clickstack-integrations/postgres/postgresql.logCreate test collector configuration
Create a file named postgres-logs-demo.yaml with the following configuration:
cat > postgres-logs-demo.yaml << 'EOF'
receivers:
  filelog/postgres:
    include:
      - /tmp/postgres-demo/postgresql.log
    start_at: beginning  # Read from beginning for demo data
    multiline:
      line_start_pattern: '^\d{4}-\d{2}-\d{2} \d{2}:\d{2}:\d{2}'
    operators:
      - type: csv_parser
        parse_from: body
        parse_to: attributes
        header: 'log_time,user_name,database_name,process_id,connection_from,session_id,session_line_num,command_tag,session_start_time,virtual_transaction_id,transaction_id,error_severity,sql_state_code,message,detail,hint,internal_query,internal_query_pos,context,query,query_pos,location,application_name,backend_type,leader_pid,query_id'
        lazy_quotes: true

      - type: time_parser
        parse_from: attributes.log_time
        layout: '%Y-%m-%d %H:%M:%S.%L %Z'

      - type: add
        field: attributes.source
        value: "postgresql-demo"

      - type: add
        field: resource["service.name"]
        value: "postgresql-demo"

service:
  pipelines:
    logs/postgres-demo:
      receivers: [filelog/postgres]
      processors:
        - memory_limiter
        - transform
        - batch
      exporters:
        - clickhouse
EOF
Run ClickStack with demo configuration
Run ClickStack with the demo logs and configuration:
docker run --name clickstack-demo \
  -p 8080:8080 -p 4317:4317 -p 4318:4318 \
  -e CUSTOM_OTELCOL_CONFIG_FILE=/etc/otelcol-contrib/custom.config.yaml \
  -v "$(pwd)/postgres-logs-demo.yaml:/etc/otelcol-contrib/custom.config.yaml:ro" \
  -v "$(pwd)/postgresql.log:/tmp/postgres-demo/postgresql.log:ro" \
  clickhouse/clickstack-all-in-one:latest
Verify logs in HyperDX
Once ClickStack is running:
- Open HyperDX and log in to your account (you may need to create an account first)
- Navigate to the Search view and set the source to
Logs - Set the time range to 2025-11-09 00:00:00 - 2025-11-12 00:00:00
Dashboards and visualization
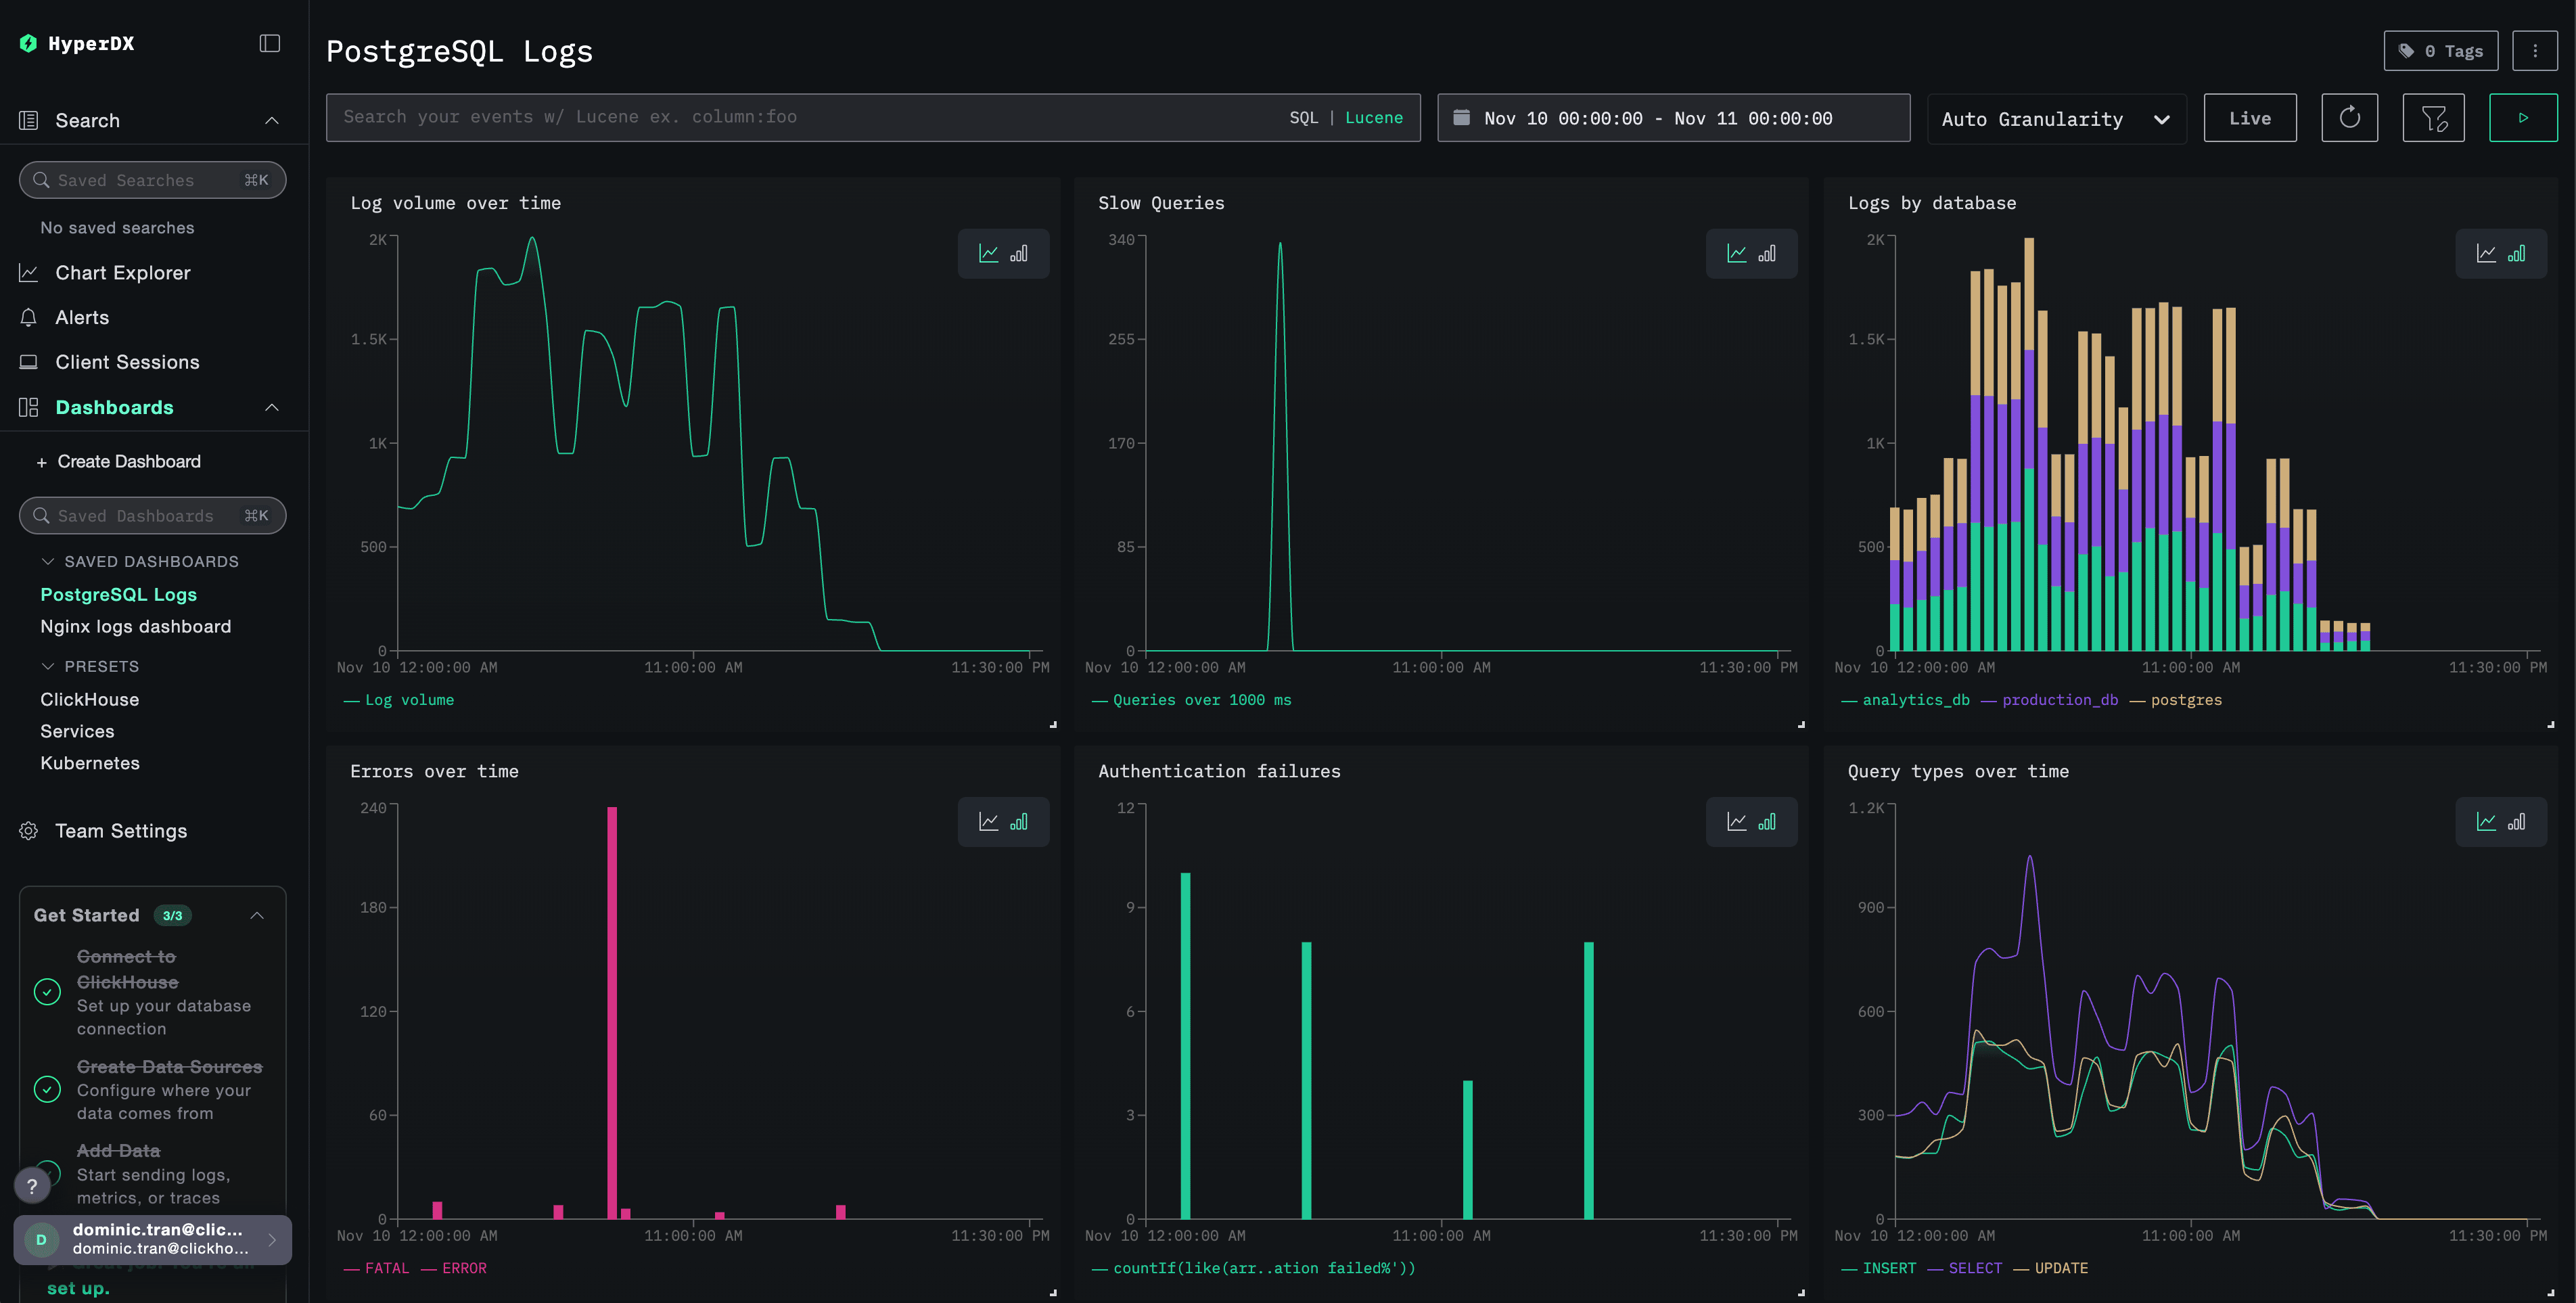
To help you get started monitoring PostgreSQL with ClickStack, we provide essential visualizations for PostgreSQL logs.
Download the dashboard configuration
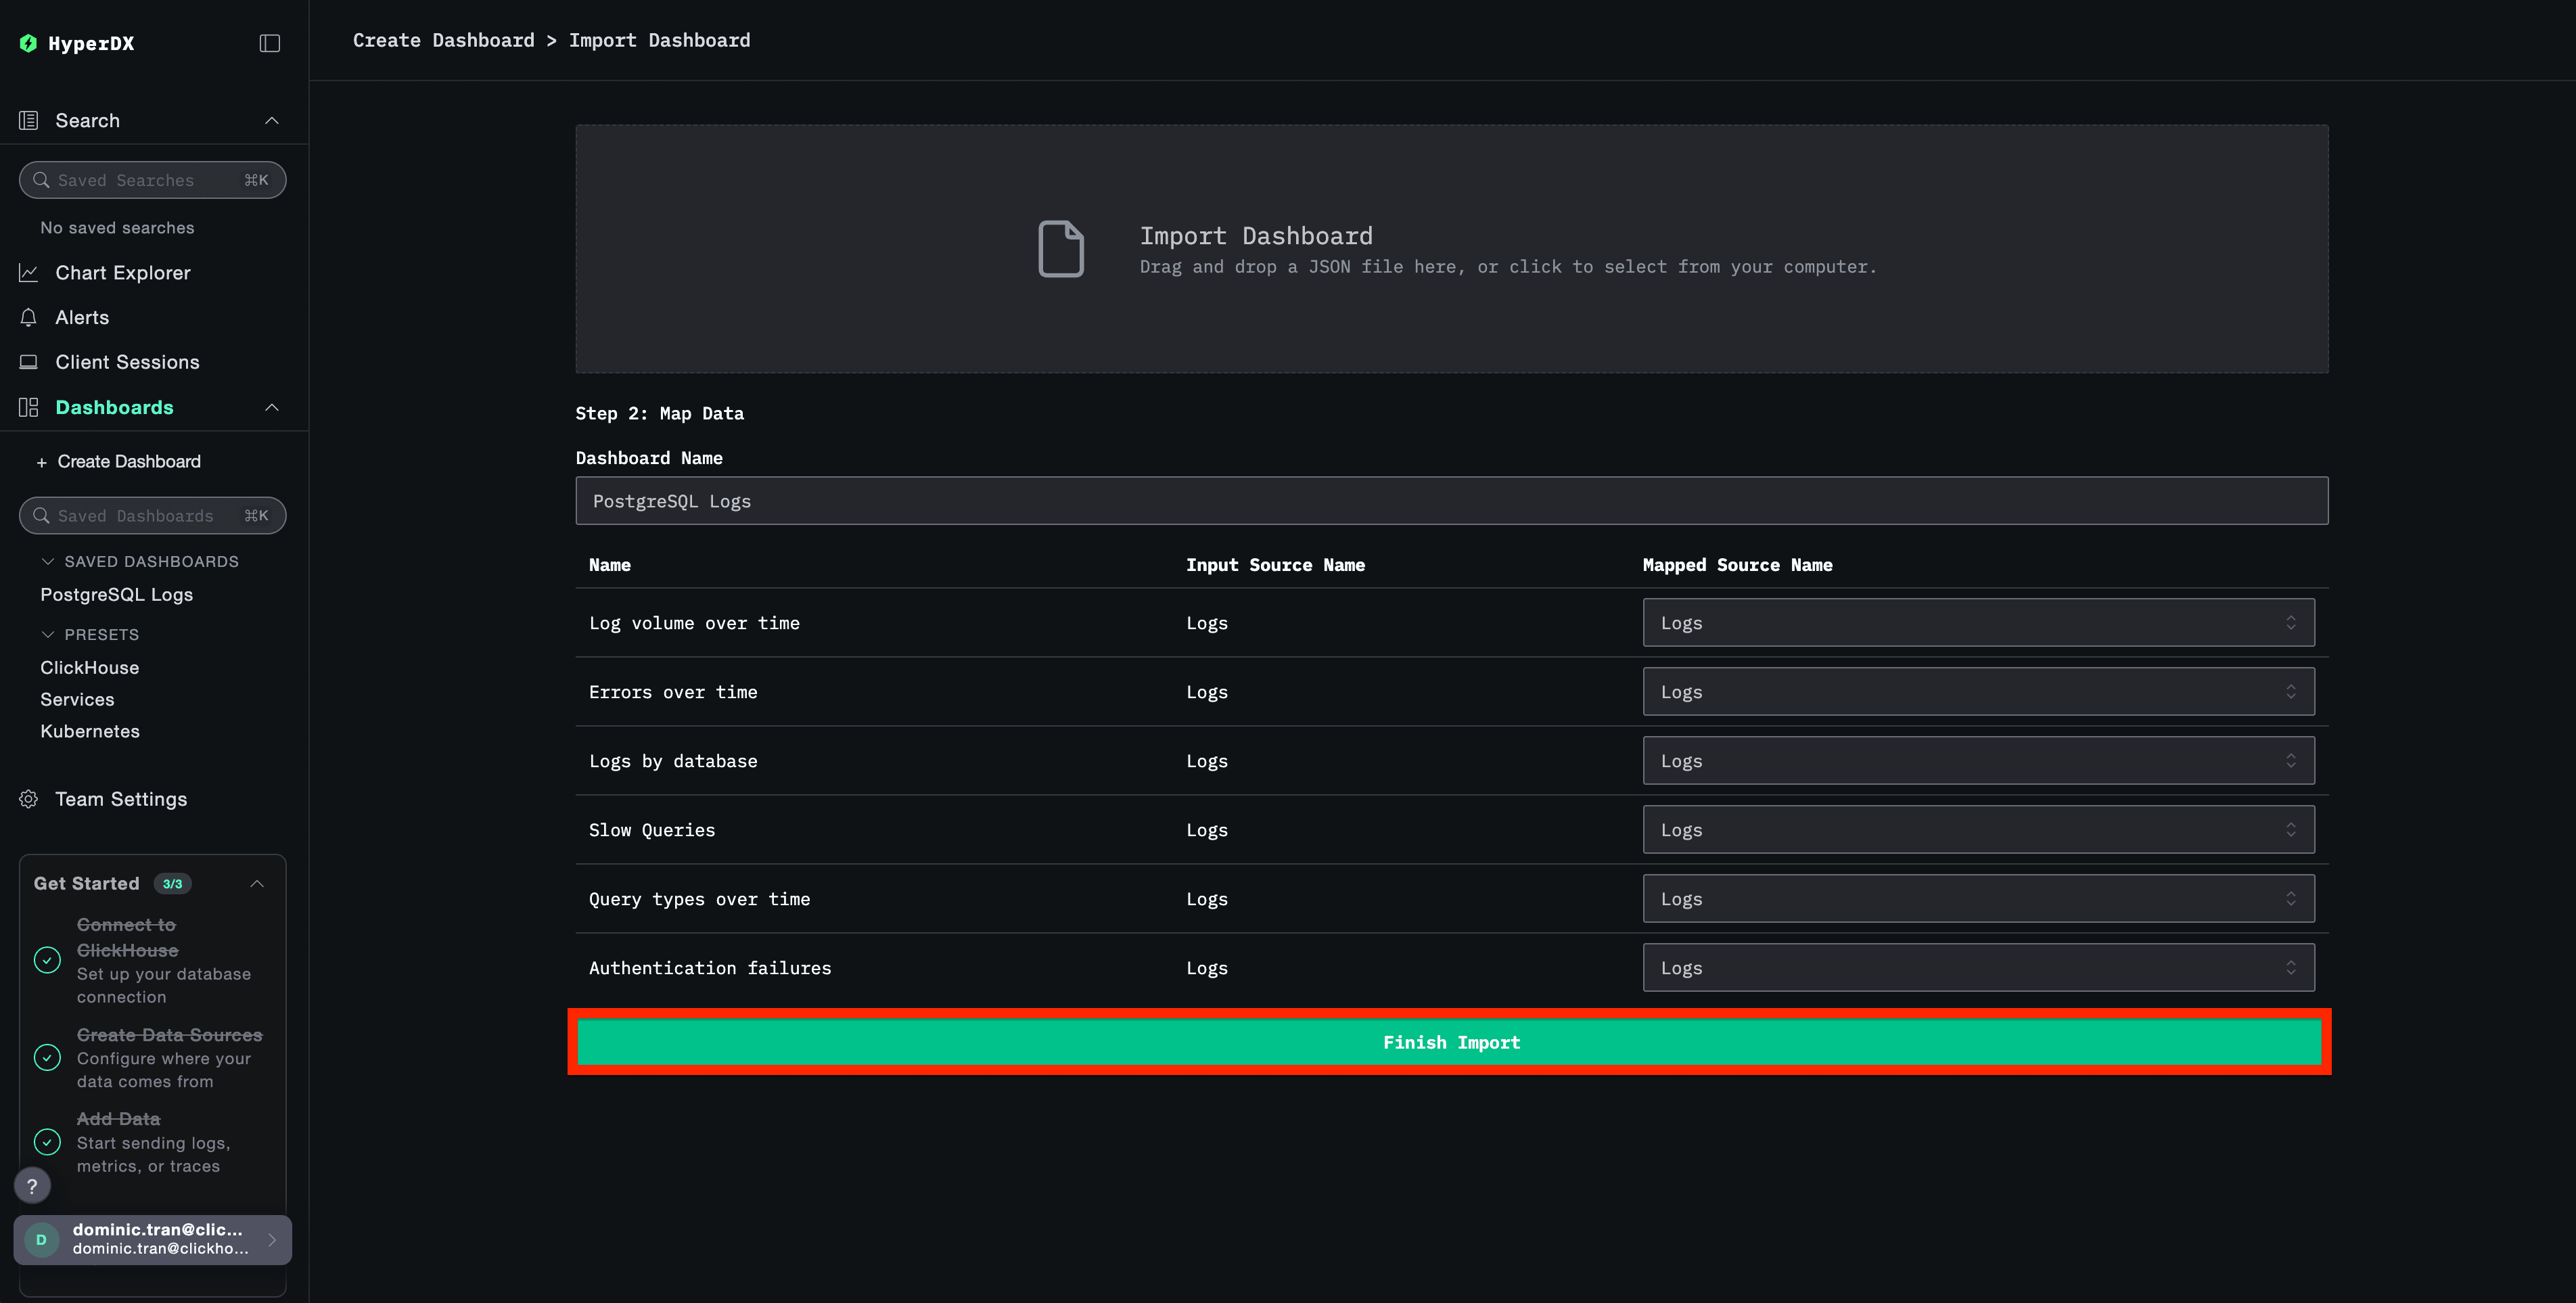
Import the pre-built dashboard
- Open HyperDX and navigate to the Dashboards section
- Click Import Dashboard in the upper right corner under the ellipses

- Upload the
postgresql-logs-dashboard.jsonfile and click Finish Import
View the dashboard
The dashboard will be created with all visualizations pre-configured:
Troubleshooting
Custom config not loading
Verify the environment variable is set:
docker exec <container-name> printenv CUSTOM_OTELCOL_CONFIG_FILECheck the custom config file is mounted and readable:
docker exec <container-name> cat /etc/otelcol-contrib/custom.config.yaml | head -10No logs appearing in HyperDX
Check the effective config includes your filelog receiver:
docker exec <container> cat /etc/otel/supervisor-data/effective.yaml | grep -A 10 filelogCheck for errors in the collector logs:
docker exec <container> cat /etc/otel/supervisor-data/agent.log | grep -i postgresIf using the demo dataset, verify the log file is accessible:
docker exec <container> cat /tmp/postgres-demo/postgresql.log | wc -lNext steps
- Set up alerts for critical events (connection failures, slow queries, error spikes)
- Correlate logs with PostgreSQL metrics for comprehensive database monitoring
- Create custom dashboards for application-specific query patterns
- Configure
log_min_duration_statementto identify slow queries specific to your performance requirements
Going to production
This guide extends ClickStack’s built-in OpenTelemetry Collector for quick setup. For production deployments, we recommend running your own OTel Collector and sending data to ClickStack’s OTLP endpoint. See Sending OpenTelemetry data for production configuration.