

 Set up docs MCP
Integration with existing Nginx
This section covers adding distributed tracing to your existing Nginx installation by installing the OpenTelemetry module and configuring it to send traces to ClickStack. If you would like to test the integration before configuring your own existing setup, you can test with our preconfigured setup and sample data in the following section.
Prerequisites
- ClickStack instance running with OTLP endpoints accessible (ports 4317/4318)
- Existing Nginx installation (version 1.18 or higher)
- Root or sudo access to modify Nginx configuration
- ClickStack hostname or IP address
Install OpenTelemetry Nginx module
The easiest way to add tracing to Nginx is using the official Nginx image with OpenTelemetry support built-in.
Using the nginx:otel image
Replace your current Nginx image with the OpenTelemetry-enabled version:
# In your docker-compose.yml or Dockerfile
image: nginx:1.27-otel
This image includes the ngx_otel_module.so pre-installed and ready to use.
Configure Nginx to send traces to ClickStack
Add OpenTelemetry configuration to your nginx.conf file. The configuration loads the module and directs traces to ClickStack’s OTLP endpoint.
First, get your API key:
- Open HyperDX at your ClickStack URL
- Navigate to Settings → API Keys
- Copy your Ingestion API Key
- Set it as an environment variable:
export CLICKSTACK_API_KEY=your-api-key-here
Add this to your nginx.conf:
load_module modules/ngx_otel_module.so;

events {
    worker_connections 1024;
}

http {
    # OpenTelemetry exporter configuration
    otel_exporter {
        endpoint <clickstack-host>:4317;
        header authorization ${CLICKSTACK_API_KEY};
    }

    # Service name for identifying this nginx instance
    otel_service_name "nginx-proxy";

    # Enable tracing
    otel_trace on;

    server {
        listen 80;

        location / {
            # Enable tracing for this location
            otel_trace_context propagate;
            otel_span_name "$request_method $uri";

            # Add request details to traces
            otel_span_attr http.status_code $status;
            otel_span_attr http.request.method $request_method;
            otel_span_attr http.route $uri;

            # Your existing proxy or application configuration
            proxy_pass http://your-backend;
        }
    }
}
If running Nginx in Docker, pass the environment variable to the container:
services:
  nginx:
    image: nginx:1.27-otel
    environment:
      - CLICKSTACK_API_KEY=${CLICKSTACK_API_KEY}
    volumes:
      - ./nginx.conf:/etc/nginx/nginx.conf:ro
Replace <clickstack-host> with your ClickStack instance hostname or IP address.
Understanding the configuration
What gets traced: Each request to Nginx creates a trace span showing:
- Request method and path
- HTTP status code
- Request duration
- Timestamp
Span attributes:
The otel_span_attr directives add metadata to each trace, allowing you to filter and analyze requests in HyperDX by status code, method, route, etc.
After making these changes, test your Nginx configuration:
nginx -tIf the test passes, reload Nginx:
# For Docker
docker-compose restart nginx

# For systemd
sudo systemctl reload nginx
Verifying traces in HyperDX
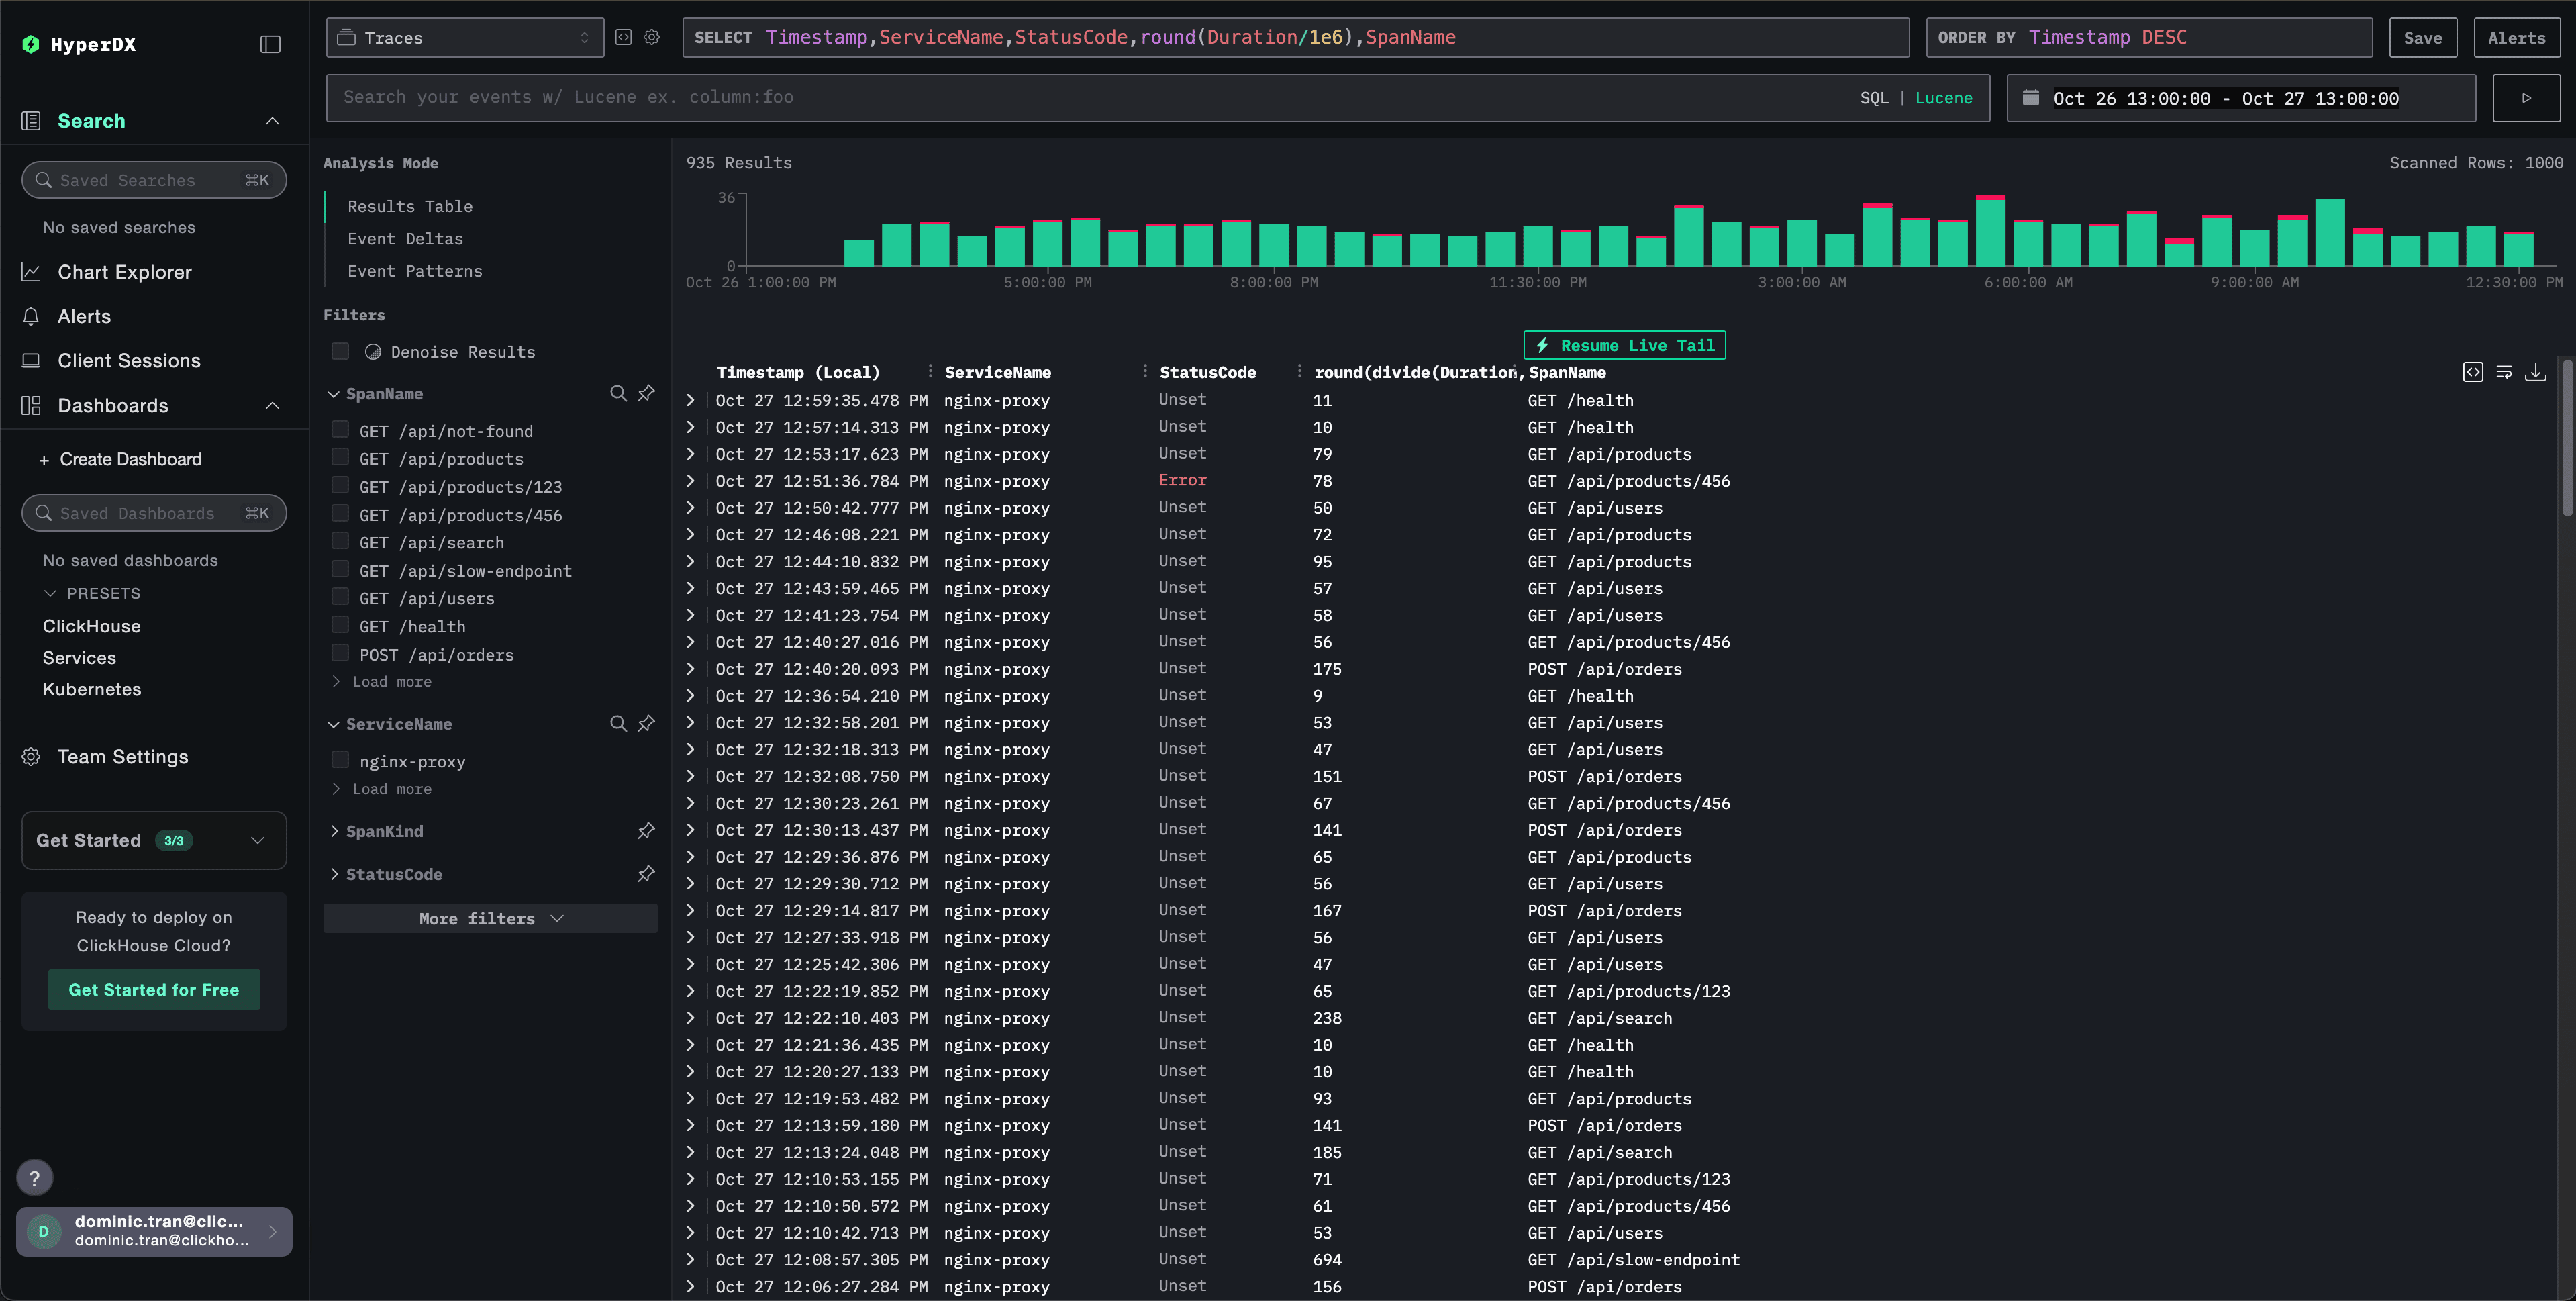
Once configured, log into HyperDX and verify traces are flowing, you should see something like this, if you don’t see traces, try adjusting your time range:
Demo dataset
For users who want to test the nginx trace integration before configuring their production systems, we provide a sample dataset of pre-generated Nginx Traces with realistic traffic patterns.
Start ClickStack
If you don’t have ClickStack running yet, start it with:
docker run --name clickstack-demo \
  -p 8080:8080 -p 4317:4317 -p 4318:4318 \
  clickhouse/clickstack-all-in-one:latest
Wait about 30 seconds for ClickStack to fully initialize before proceeding.
- Port 8080: HyperDX web interface
- Port 4317: OTLP gRPC endpoint (used by nginx module)
- Port 4318: OTLP HTTP endpoint (used for demo traces)
Download the sample dataset
Download the sample traces file and update timestamps to the current time:
# Download the traces
curl -O https://datasets-documentation.s3.eu-west-3.amazonaws.com/clickstack-integrations/nginx-traces-sample.json
The dataset includes:
- 1,000 trace spans with realistic timing
- 9 different endpoints with varied traffic patterns
- ~93% success rate (200), ~3% client errors (404), ~4% server errors (500)
- Latencies ranging from 10ms to 800ms
- Original traffic patterns preserved, shifted to current time
Send traces to ClickStack
Set your API key as an environment variable (if not already set):
export CLICKSTACK_API_KEY=your-api-key-hereGet your API key:
- Open HyperDX at your ClickStack URL
- Navigate to Settings → API Keys
- Copy your Ingestion API Key
Then send the traces to ClickStack:
curl -X POST http://localhost:4318/v1/traces \
  -H "Content-Type: application/json" \
  -H "Authorization: $CLICKSTACK_API_KEY" \
-d @nginx-traces-sample.jsonYou should see a response like {"partialSuccess":{}} indicating the traces were successfully sent. All 1,000 traces will be ingested into ClickStack.
Verify traces in HyperDX
- Open HyperDX and log in to your account (you may need to create an account first)
- Navigate to the Search view and set the source to
Traces - Set the time range to 2025-10-25 13:00:00 - 2025-10-28 13:00:00
Here’s what you should see in your search view:
Dashboards and visualization
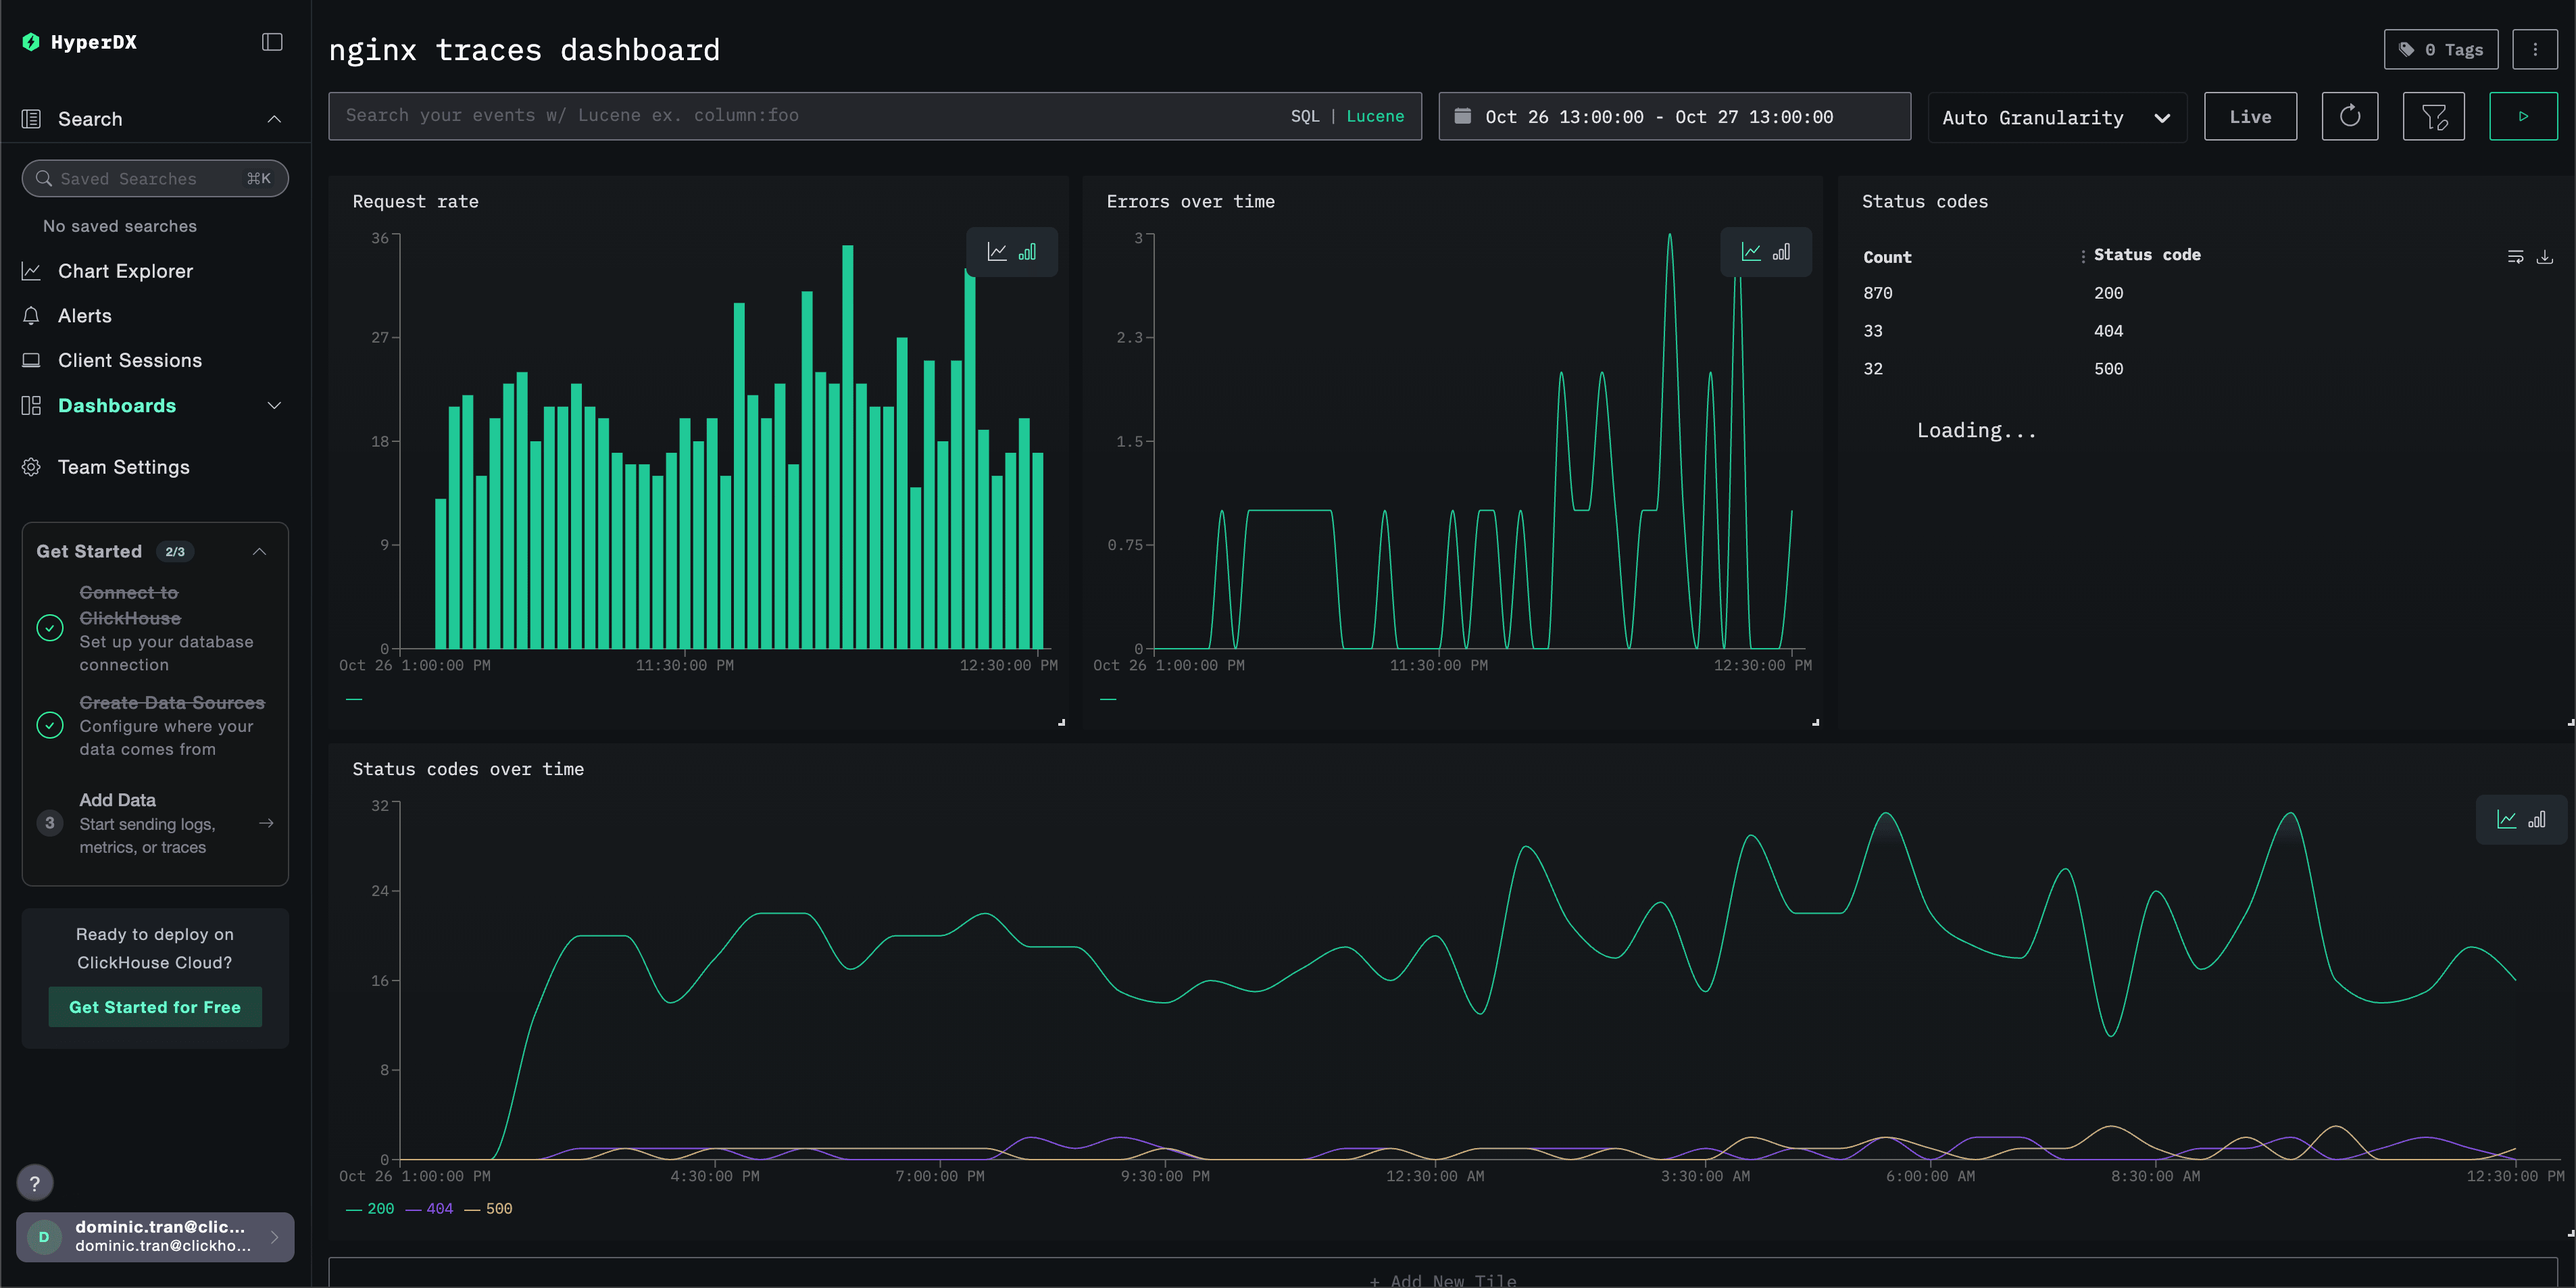
To help you get started monitoring traces with ClickStack, we provide essential visualizations for trace data.
Download the dashboard configuration
Import the pre-built dashboard
- Open HyperDX and navigate to the Dashboards section.
- Click “Import Dashboard” in the upper right corner under the ellipses.

- Upload the nginx-trace-dashboard.json file and click finish import.
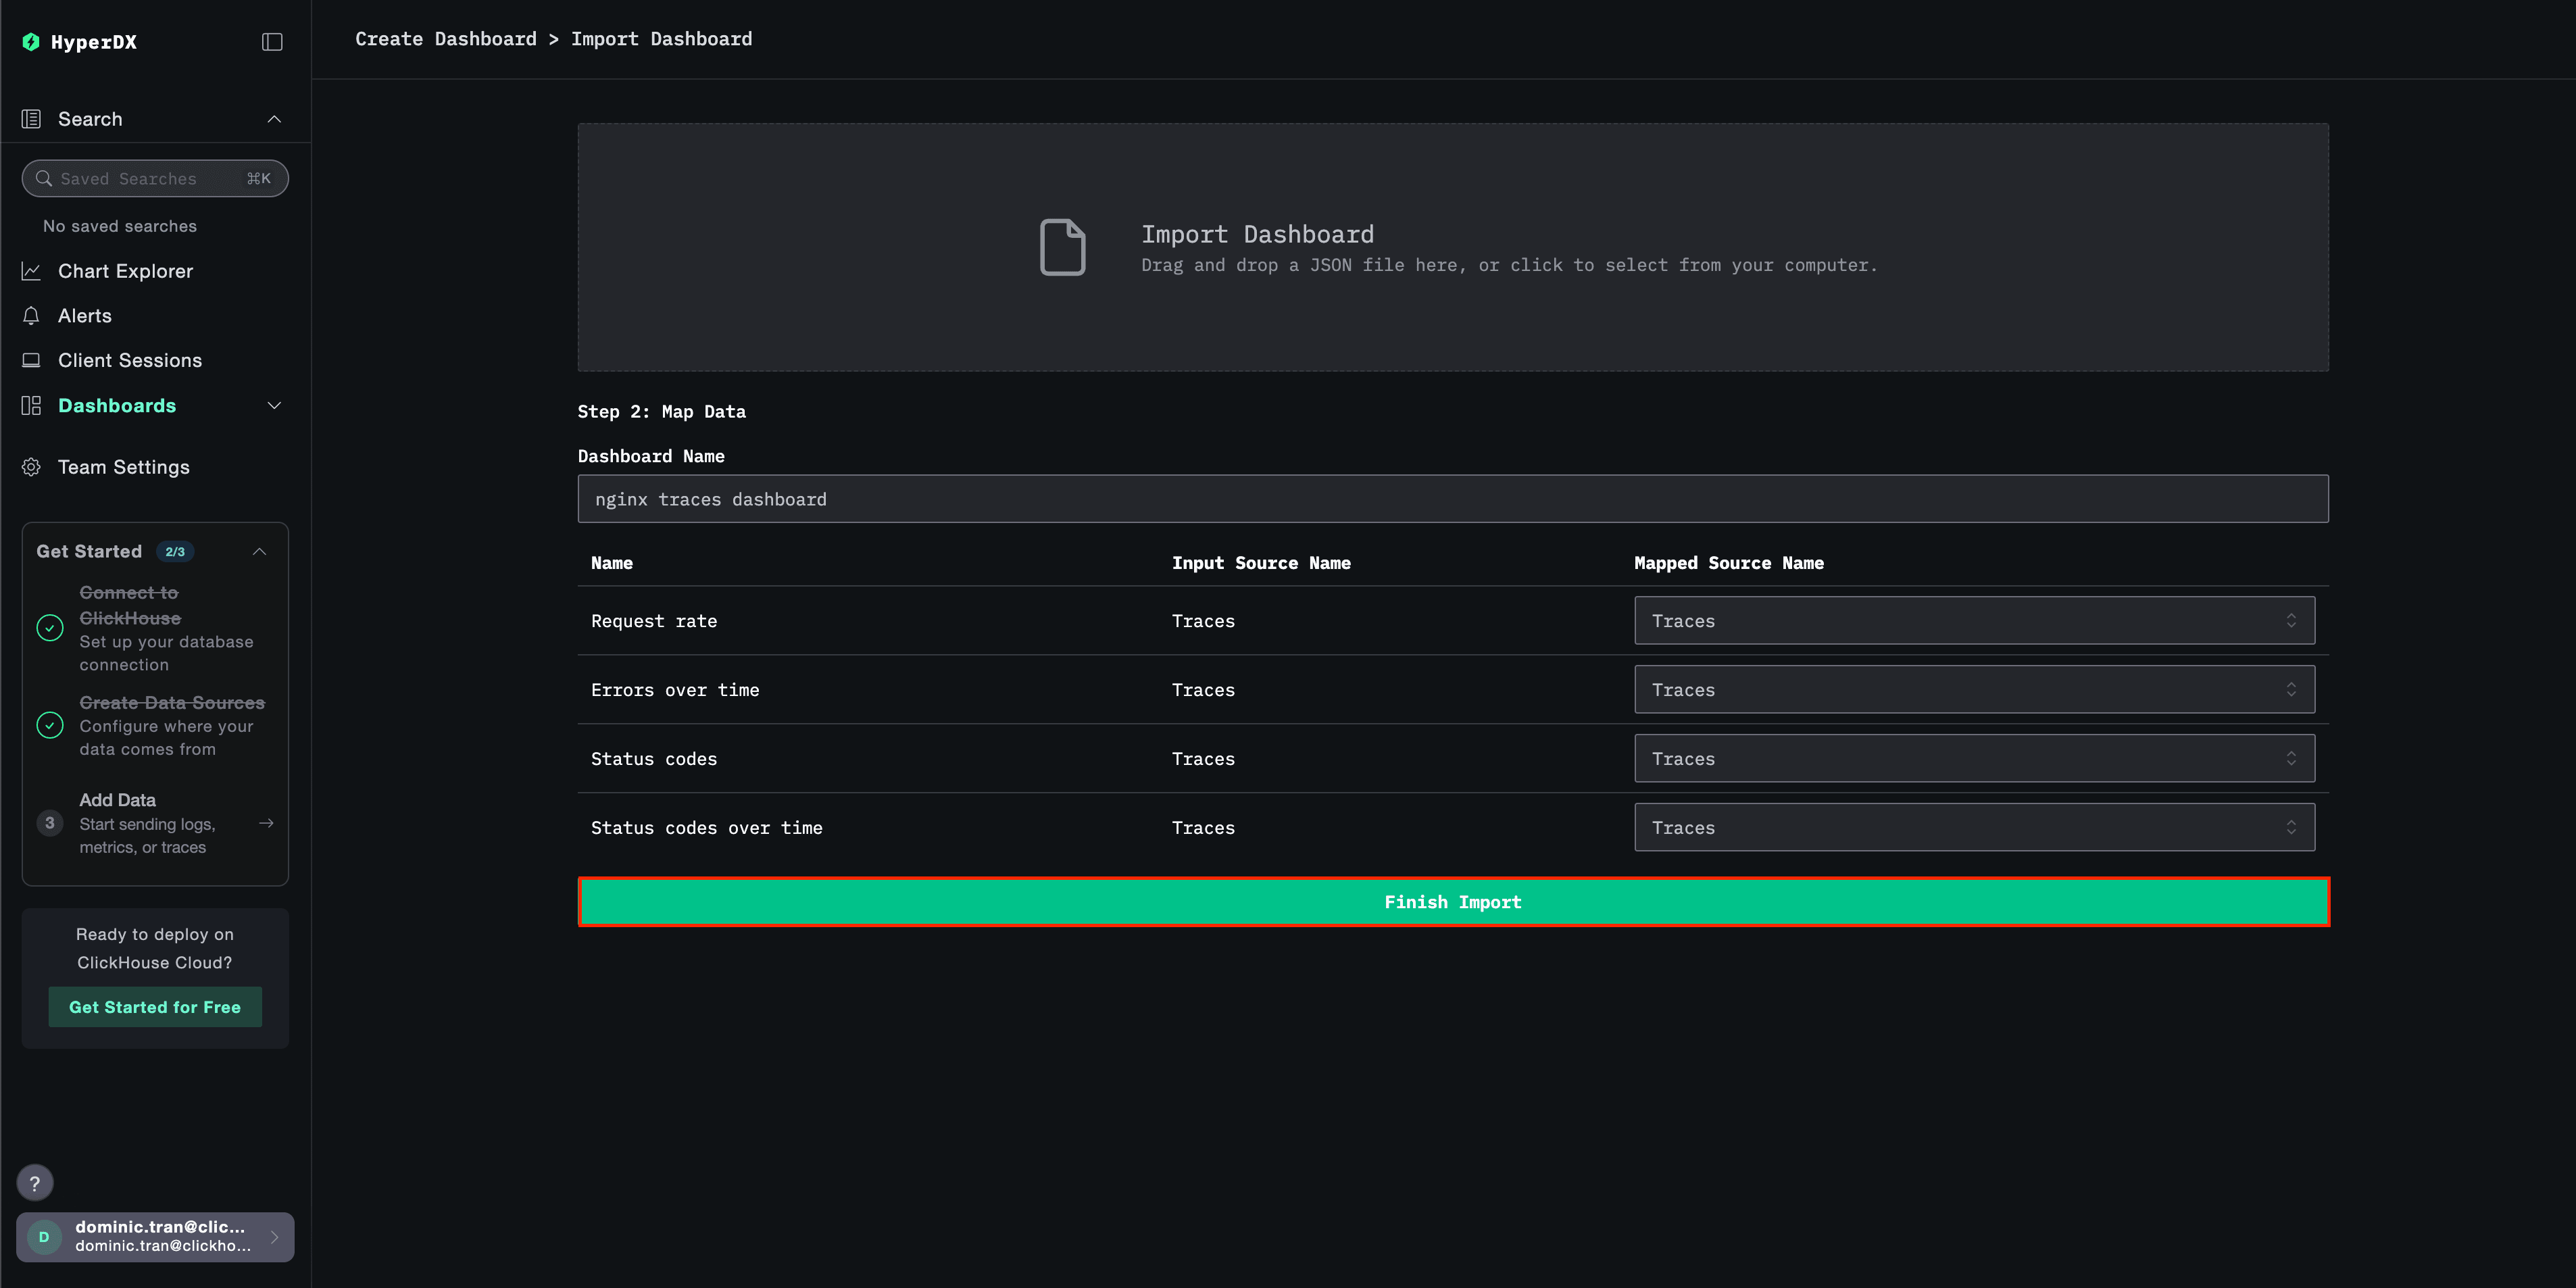
The dashboard will be created with all visualizations pre-configured.
Troubleshooting
No traces appearing in HyperDX
Verify nginx module is loaded:
nginx -V 2>&1 | grep otelYou should see references to the OpenTelemetry module.
Check network connectivity:
telnet <clickstack-host> 4317This should connect successfully to the OTLP gRPC endpoint.
Verify API key is set:
echo $CLICKSTACK_API_KEYShould output your API key (not empty).
Check nginx error logs:
# For Docker
docker logs <nginx-container> 2>&1 | grep -i otel

# For systemd
sudo tail -f /var/log/nginx/error.log | grep -i otel
Look for OpenTelemetry-related errors.
Verify nginx is receiving requests:
# Check access logs to confirm traffic
tail -f /var/log/nginx/access.log
Next steps
- Set up alerts for critical metrics (error rates, latency thresholds)
- Create additional dashboards for specific use cases (API monitoring, security events)
Going to production
This guide sends traces directly from the Nginx OpenTelemetry module to ClickStack’s OTLP endpoint. For production deployments, we recommend running your own OTel Collector as a gateway to provide batching and resilience. See Sending OpenTelemetry data for production configuration.